

Process Capability Indices (Cp, Cpk, Pp, Ppk)
The process capability indices, as they are widely used by industry today, are the capability ratio, Cp, the centered capability ratio, Cpk, the performance ratio, Pp, and the centered performance ratio, Ppk. Collectively, the indices contain “all of the information regarding the relationship between the process and the specifications that can be incorporated into numerical summaries” (Wheeler, More Capability Confusion, 3). The formulas for the process capability indices, as defined by the statistician and quality control expert Donald J. Wheeler, are:
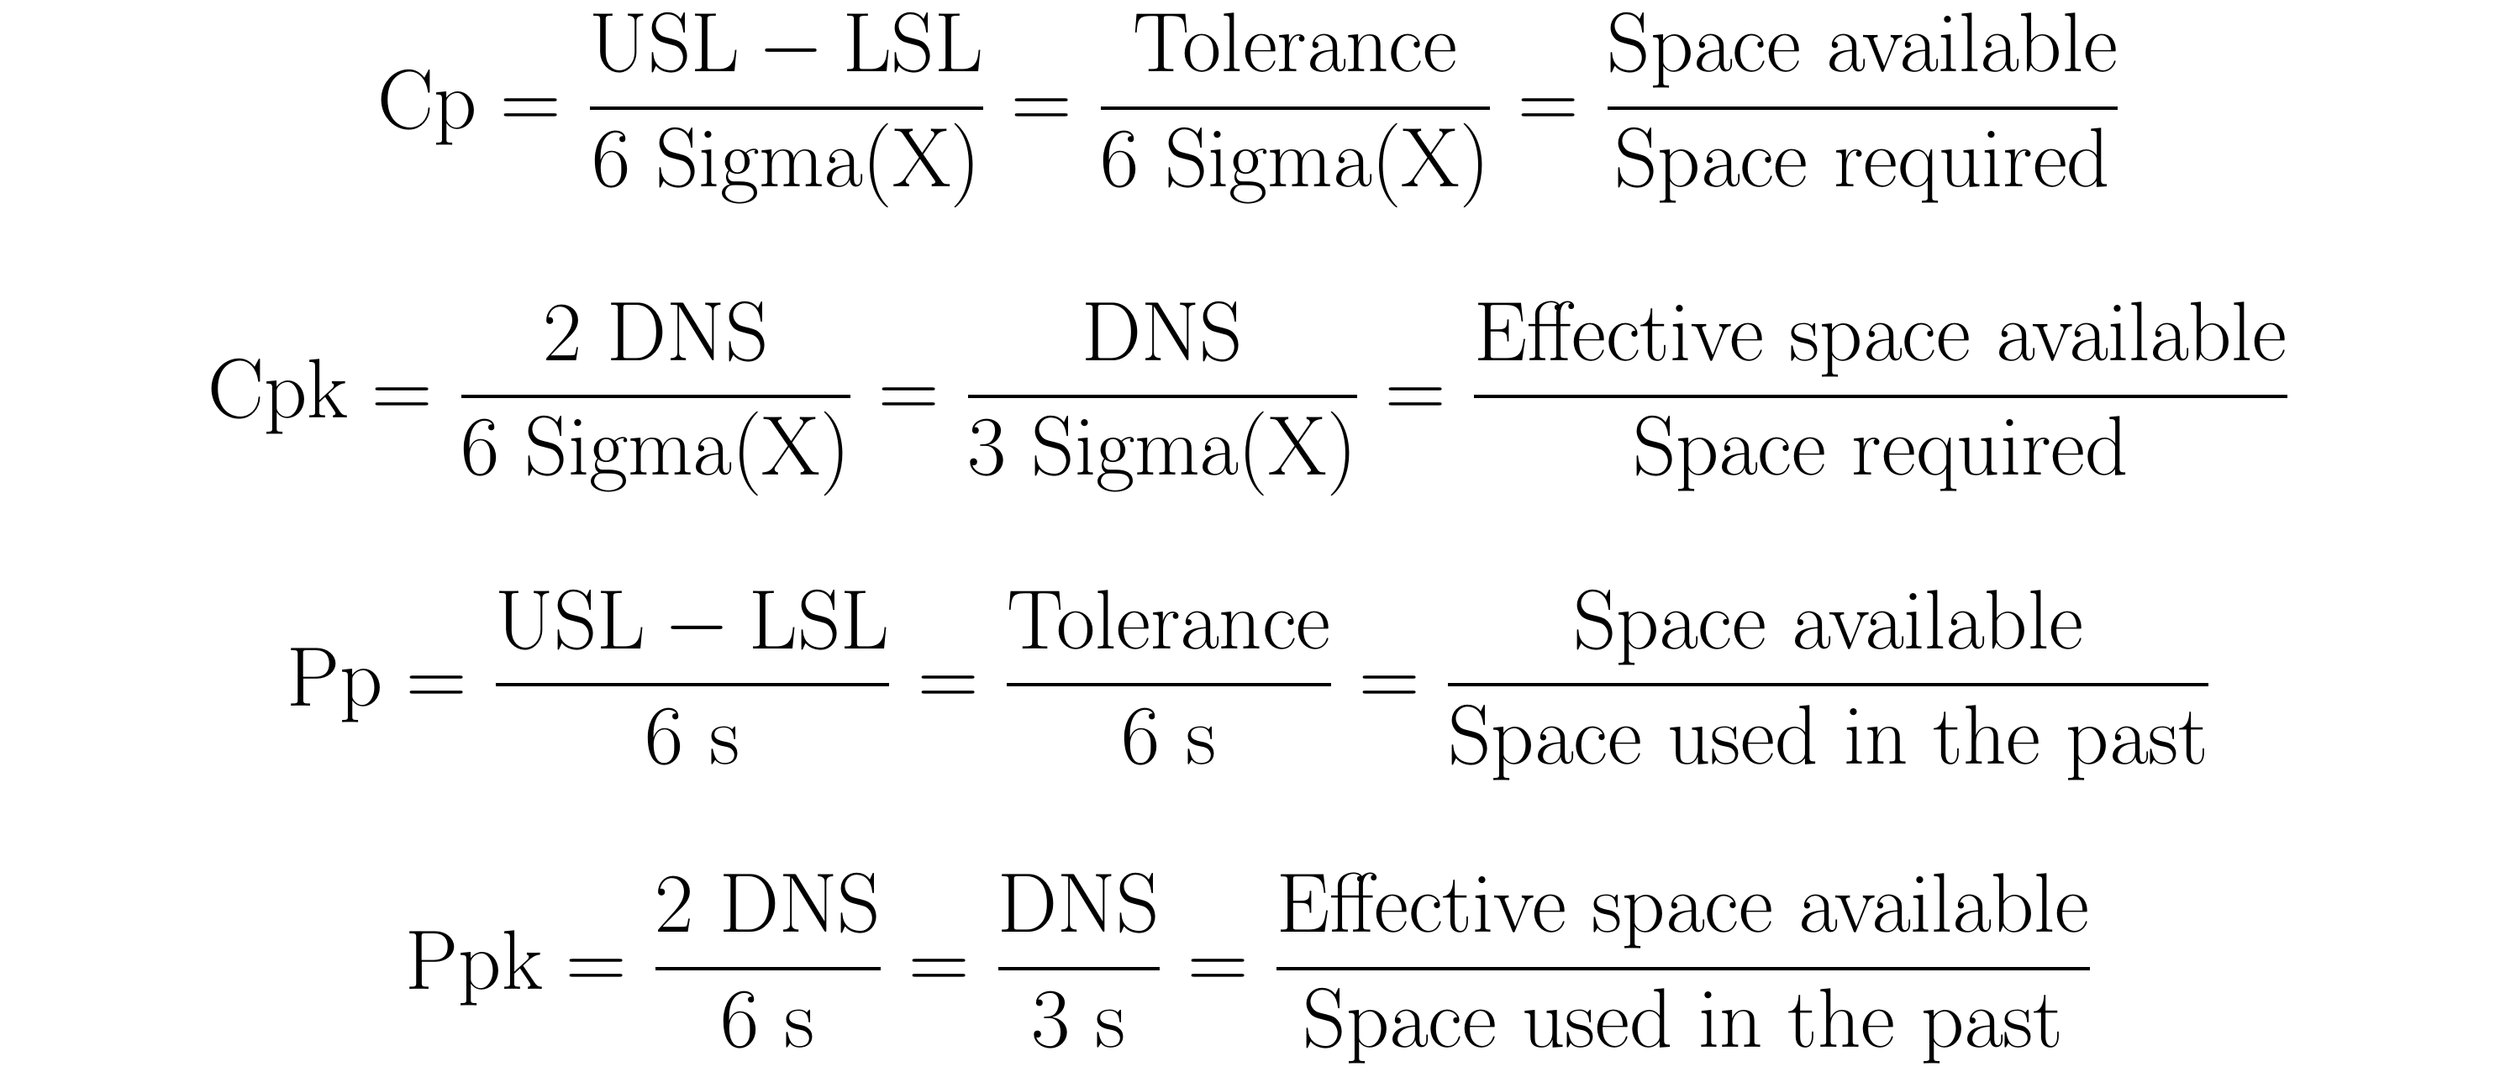
Table of contents
Tolerance
To understand the process capability indices an understanding of their requisite parts is required. The Tolerance defines the acceptable range within which performance or quality characteristics may vary, thereby defining the total space available for the process. To calculate the tolerance, subtract the Lower Specification Limit (LSL) from the Upper Specification Limit (USL).:

Measurements of parts, assemblies, and products that fall inside the specification limits (tolerance) are conforming, while those that fall outside are nonconforming. Thus, the tolerance defines the voice of the customer. It defines what a customer is willing (and not willing) to pay for.
For additional details about the tolerance click here.
Distance to nearer specification, DNS
The distance to the nearer specification, DNS, is the distance from the mean to the nearer specification limit. It serves as a measure of how centered a process is within the tolerance. When the mean is centered at the target, the distance from the mean to each specification limit will be similar (converge). When the mean is biased toward one of the specification limits, the distance from the mean to each specification limit will diverge.
To calculate the DNS, subtract the Lower Specification Limit (LSL) from the mean and subtract the mean from the Upper Specification Limit (USL). The DNS is the smaller of these two values. In practice, calculation of the DNS is achieved using a MIN() function. This function returns the smaller of its two arguments. The formula for the DNS is written as:

When the mean falls inside the specification limits the values returned by the MIN() function will be positive. When the mean is less than the LSL, the (Mean - LSL) term of the MIN() function will be negative. When the mean is greater than the USL, the (USL - Mean) term will be negative.
The DNS will always be less than or equal to one-half of the tolerance. Thus, the relationship between the tolerance and the DNS is written as:

Rewriting this equation in terms of the tolerance yields the formula:

Sigma(X)
Hence, the DNS, which defines the numerators of the centered capability ratio and the centered performance ratio, reflects how the tolerance bounds the distance from the mean to the nearer specification limit.
Sigma(X) is a generic placeholder for one of several within-subgroup measures of dispersion that changes with respect to subgroup size. When a dataset is composed of logically comparable individual values, Sigma(X) is calculated by dividing the average moving range by the bias correction factor, d2 = 1.128.

Readers that are familiar with process behavior charts will recognize the Sigma(X) quantity from Walter Shewhart’s generic formula for calculating process limits, Average ± 3ᐧSigma(X). For process limits to be robust and capable of detecting assignable causes of exceptional variation, a measure of dispersion that is capable of detecting process behavior that is nonhomogeneous is required. The Sigma(X) term uses “the moving ranges to characterize the short-term, point-to-point variation” making it capable of this task.
The quantity 6ᐧSigma(X) that defines the denominators of the capability ratio and the centered capability ratio represents the full span of the three-sigma distance used to calculate process limits. It represents the generic space required by a process (process spread) to operate at its full potential.
Standard deviation
The global standard deviation, s, is the measure of dispersion taught in every introductory statistics course. By way of its calculation, it assumes that a dataset “can be logically considered to be one large homogeneous collection of values, all obtained from the same underlying and unchanging process” (Wheeler, Making Sense of Data, 162). Thus, when a process is operated predictably, the standard deviation summarizes the space used by the process in the past. When a process is operated unpredictably, the standard deviation tends to be inflated. In these instances, it still describes the past but this description provides no insight into whether or not the process is being operated predictably.

What does each index measure?
By understanding the quantities that compose the process capability indices, what each index measures becomes clear. The capability ratio, Cp, divides the tolerance by the quantity 6 Sigma(X). Thus, it expresses the space available to a process, allotted by the tolerance, as a multiple of the space required when the process is operated on-target and predictably.
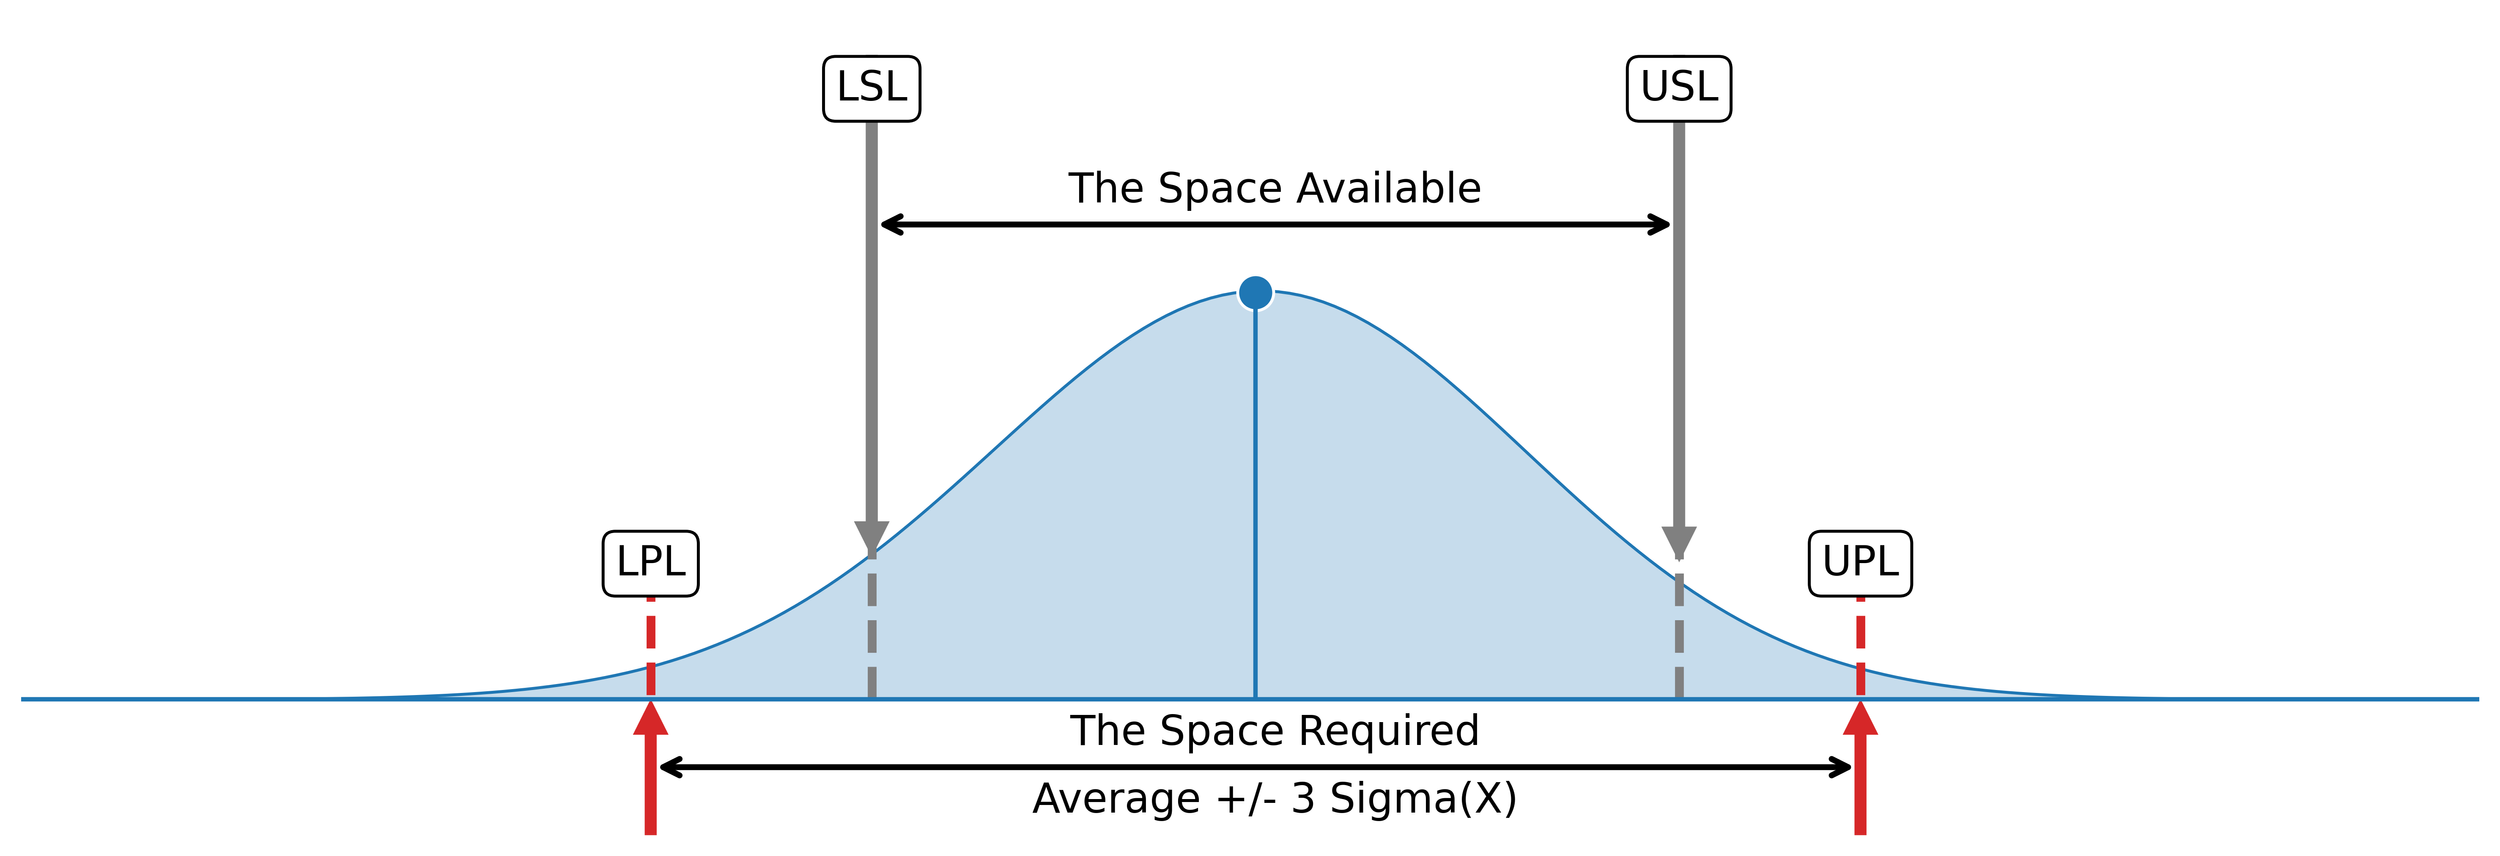
Figure 1. The relationship between the space available and the space required.
The centered capability ratio, Cpk, divides the DNS by the quantity 3Sigma(X). Thus, it expresses the effective space available to a process as a multiple of the space required when the process is operated at its current mean.
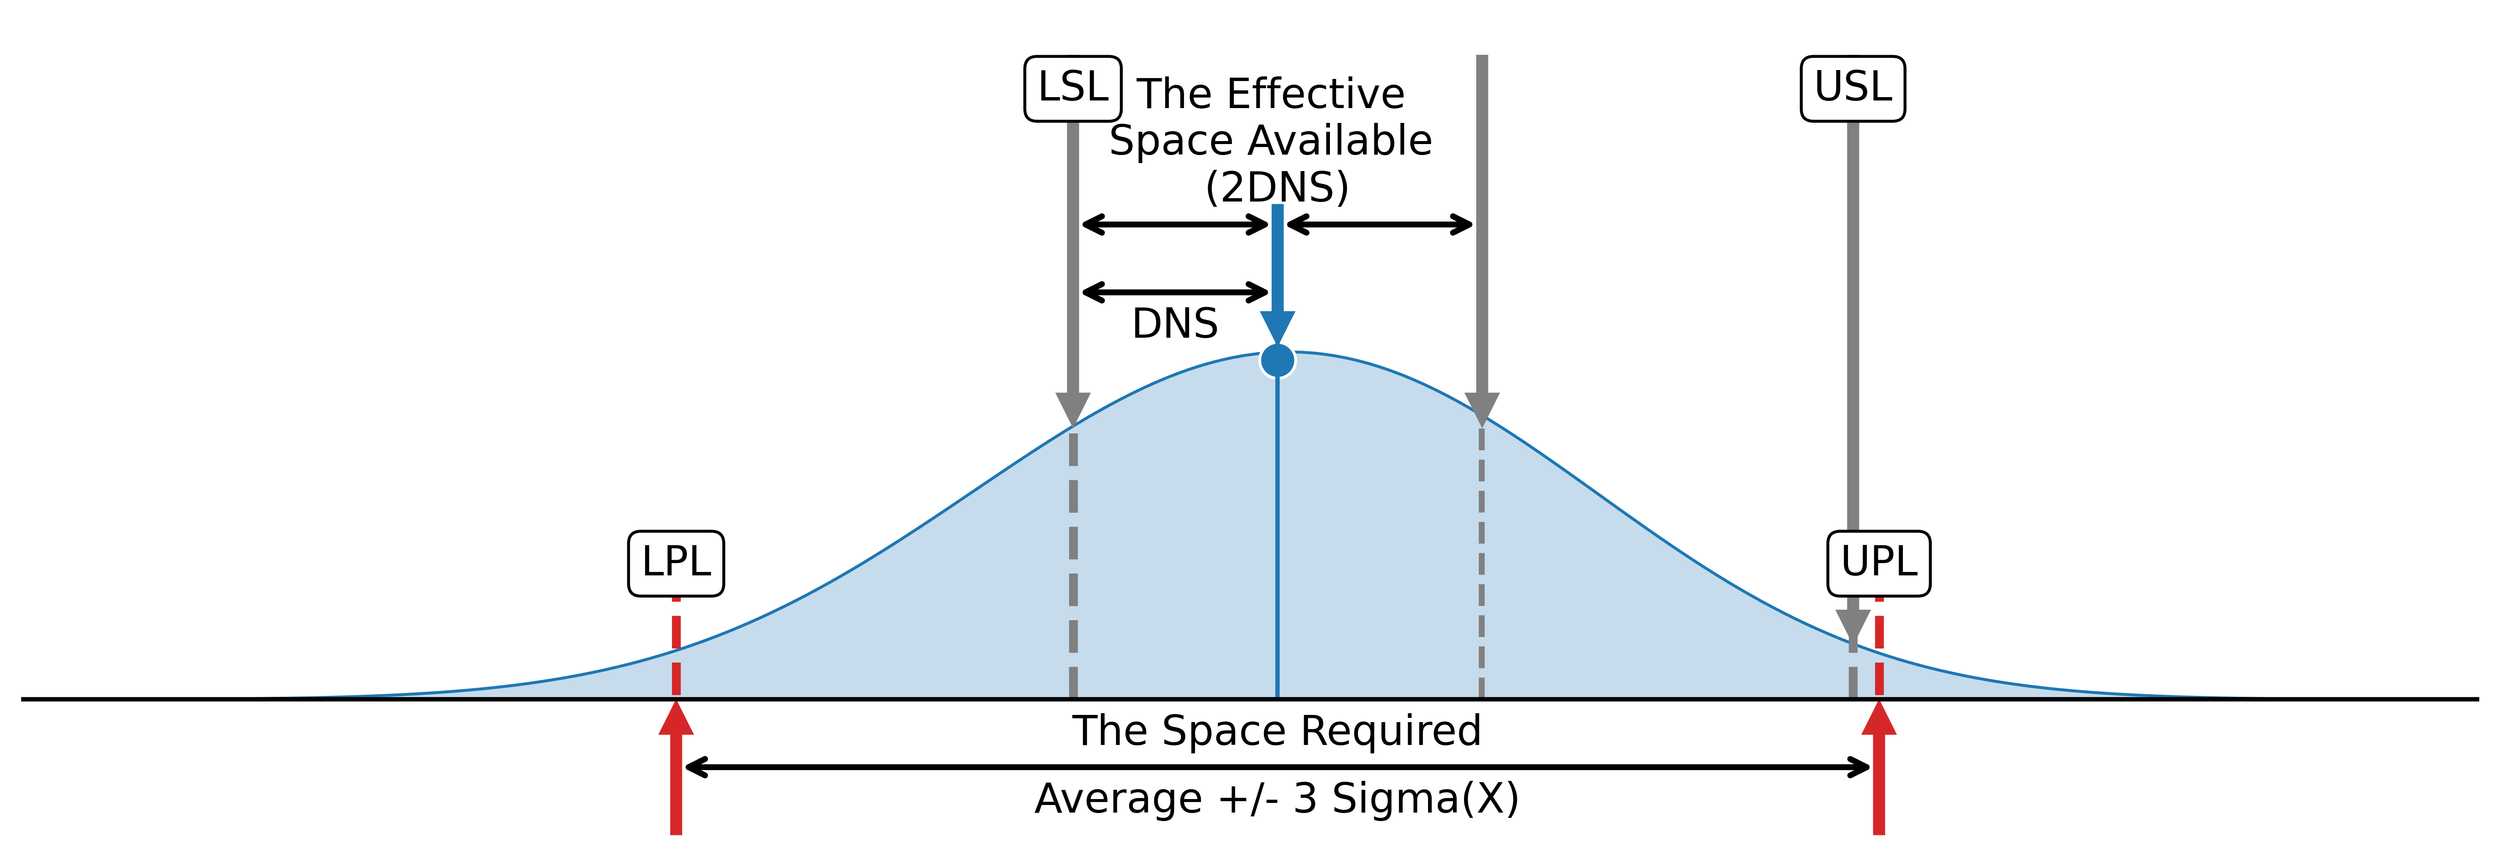
Figure 2. The relationship between the effective space available and the space required.
By comparing the centered capability ratio with the capability ratio, a characterization of how far off-target a process is operating is revealed. As the two ratios converge, the closer a process is operating to on-target. As the two ratios diverge, the further a process is operating from on-target.
The sign of the centered capability ratio, whether it is positive or negative, reveals if the mean falls within the specification limits or outside of them by way of the DNS. As noted earlier, the DNS is the smaller of the two values: Mean - LSL and USL - Mean. When either of these values is negative, the mean falls outside of the specification limits making the DNS negative. In turn, the centered capability ratio will also be negative. Thus, a negative centered capability ratio indicates that the mean falls outside of the tolerance.
The performance ratio, Pp, divides the tolerance by the quantity 6s. Thus, it expresses the space available to a process, allotted by the tolerance, as a multiple of the space used by the process in the past.
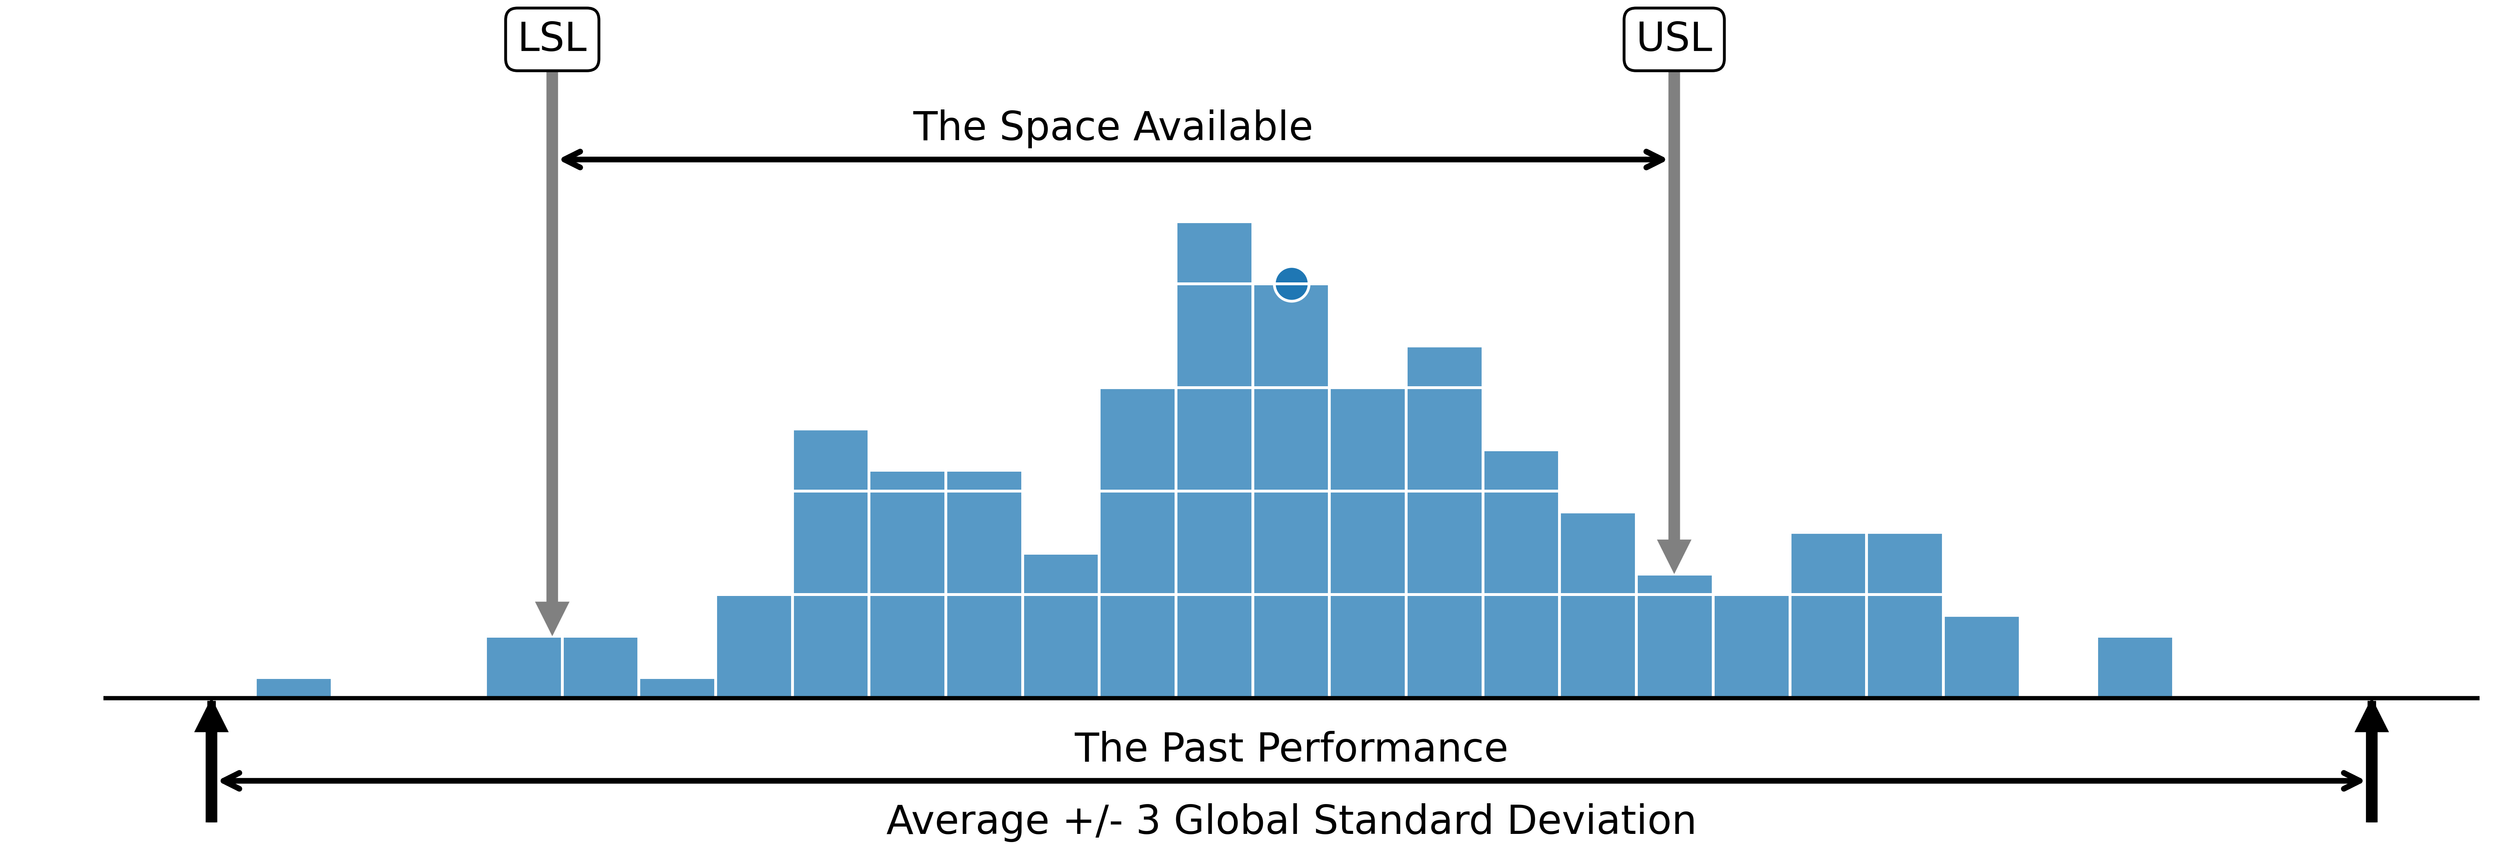
Figure 3. The relationship between the space available and the space used in the past.
As the space used in the past and the space required by the process converge, so too will the performance ratio converge with the capability ratio. This convergence is indicative of a process that is being operated predictably.
The centered performance ratio, Ppk, divides the distance to the nearer specification, DNS, by the quantity 3s. Thus, it expresses the effective space available to a process as a multiple of the space used by the process in the past. By way of its calculation, Ppk describes a process in its current state without considering what it has the potential to do.
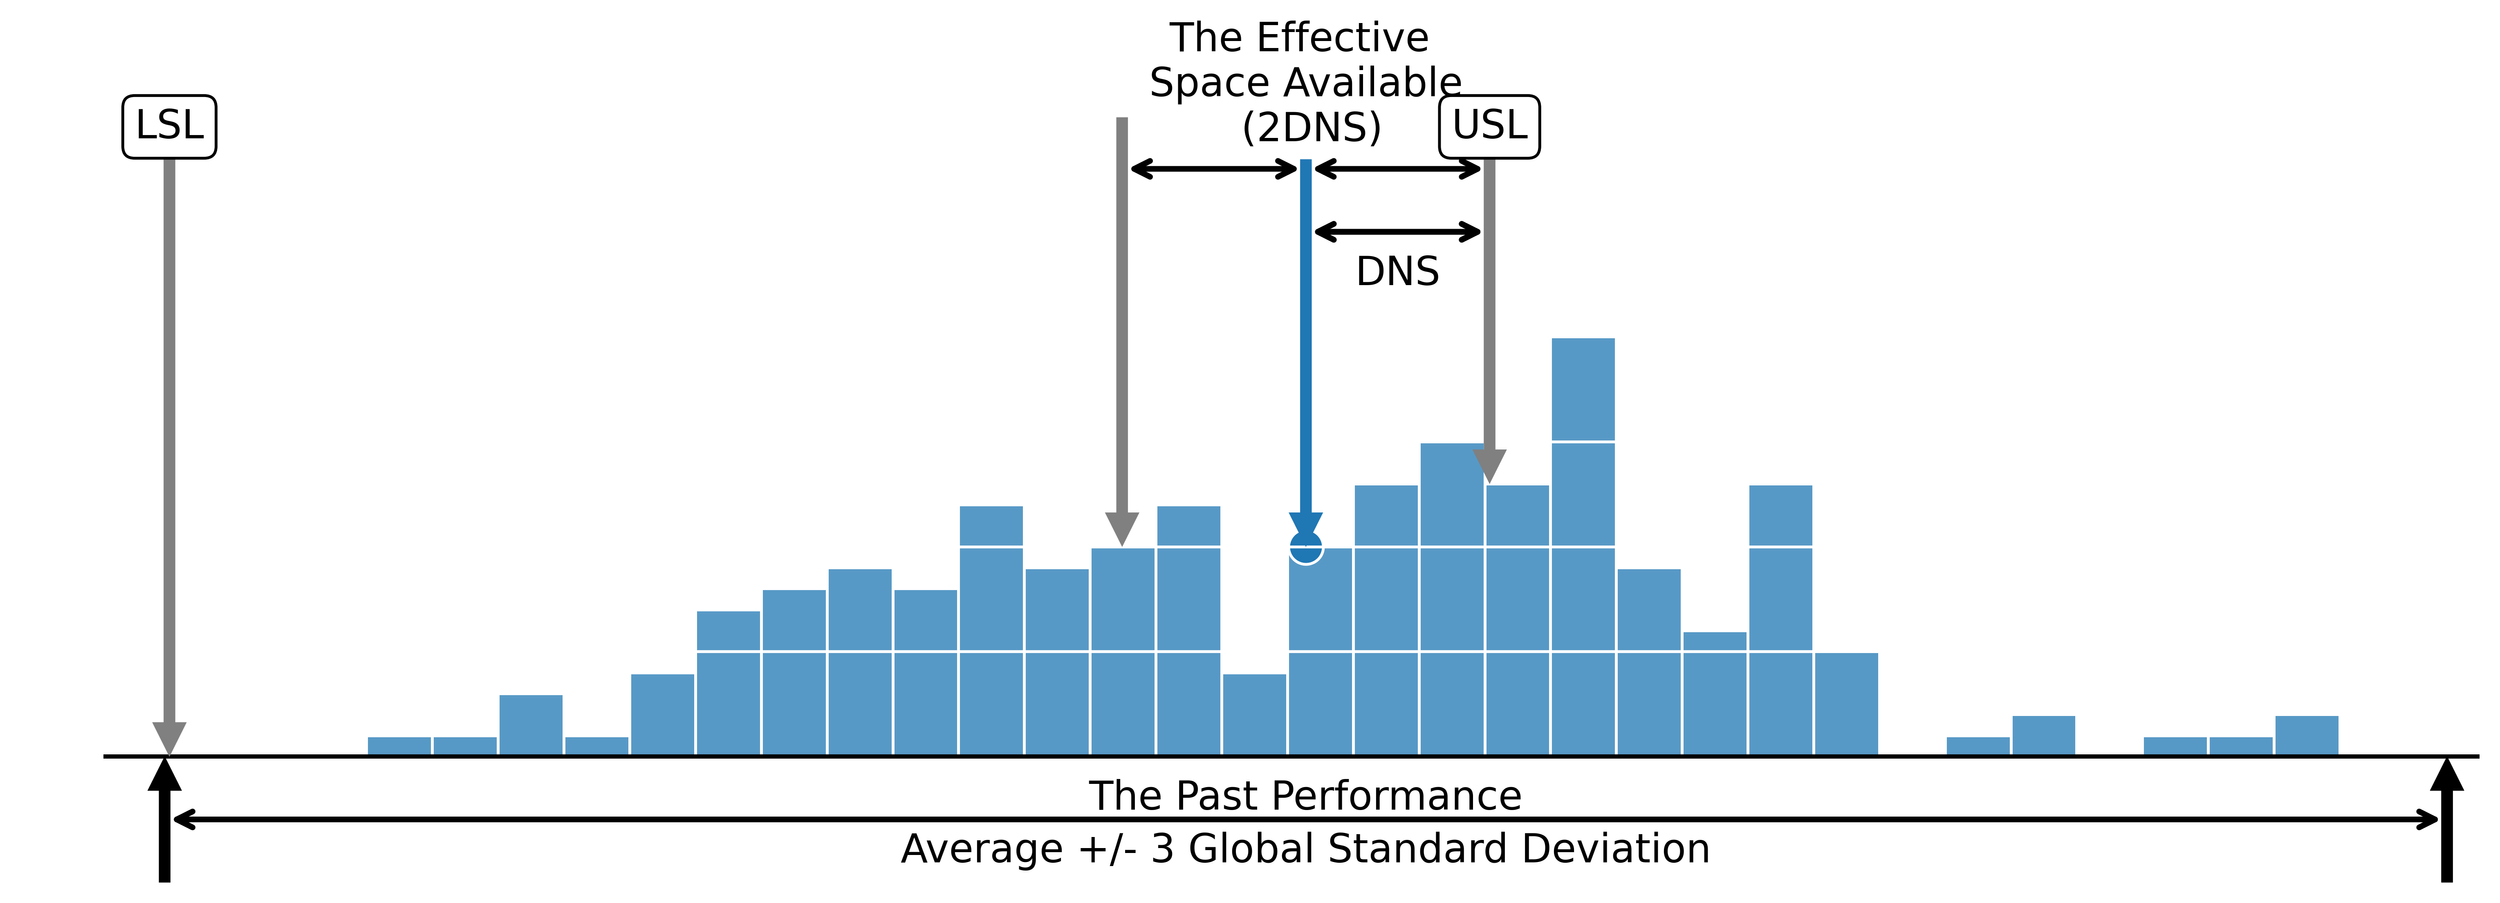
Figure 4. The relationship between the effectives space available and the space used in the past.
When the centered performance ratio is compared with the performance ratio, how far off-target a process is operating is revealed. As the two ratios converge, the closer a process is operating to on-target. As the two ratios diverge, the further a process is operating from on-target
Comparing the indices
Comparing the four process capability indices to each other reveals insights into the behavior of the underlying causal system. When the values of the four indices diverge, it implies that the underlying causal system is influenced by both common causes of routine variation and assignable causes of exceptional variation. Thus, it is being operated unpredictably. When the values of the four indices converge (they will rarely be exactly the same), it implies that the underlying causal system is influenced by only common causes of routine variation. Thus, it is being operated unpredictably. The only way to definitely know what types of variation influence process behavior is by characterizing the underlying causal system using a process behavior chart.
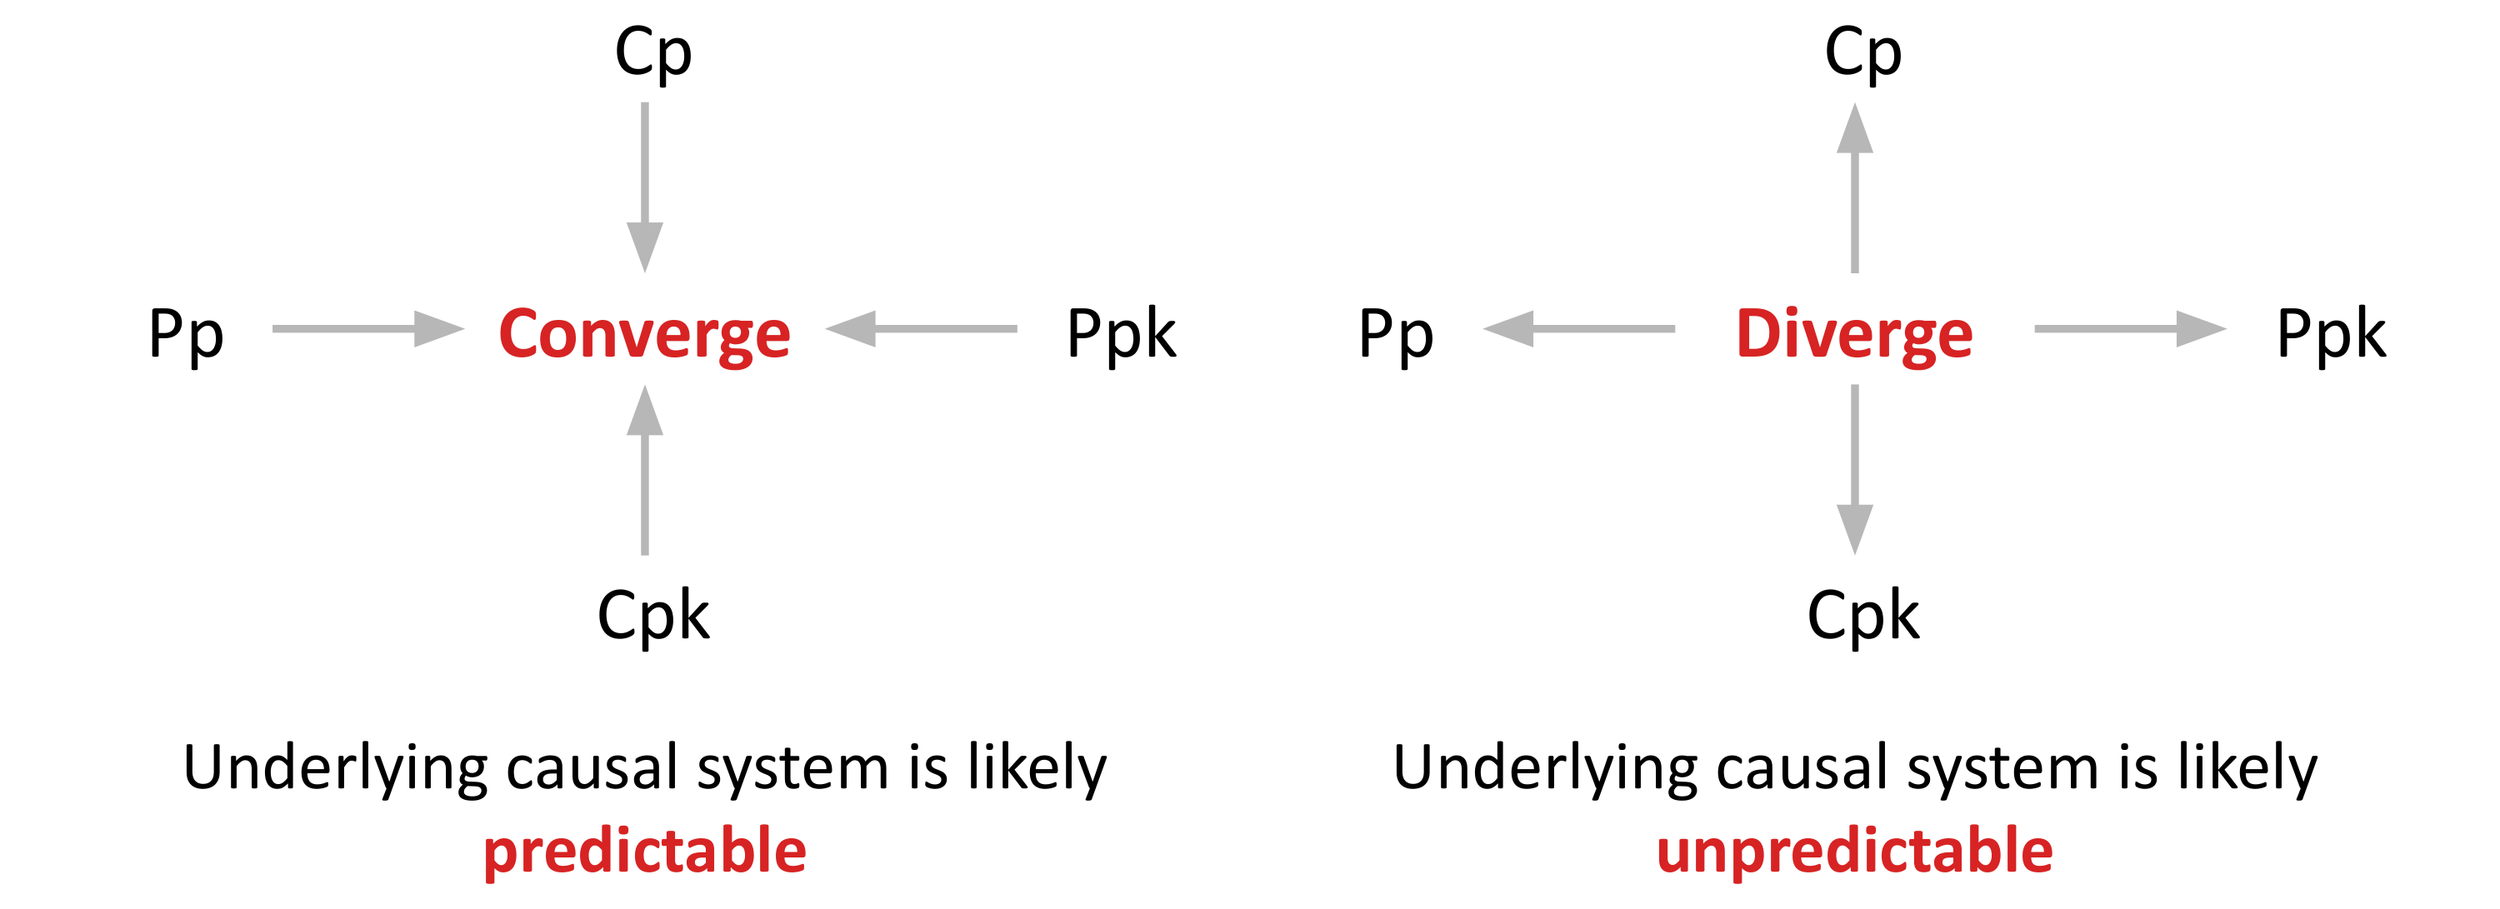
Figure 5. When the process capability indices converge, it implies that the underlying causal system is behaving predictably. When the indices diverge, it implies that the underlying causal system is behaving unpredictably.
A word of warning
The Process Capability Indices, like all process parameters, are not well-defined until the underlying causal system is operated predictably. Whenever a process is operated unpredictably, that is it is influenced by both common causes of routine variation and assignable causes of exceptional variation, the process parameters, including the process mean, the process standard deviation, and the process capability indices, will change over time. While we can always compute statistics regardless of the characterization (predictable or unpredictable), the only time this arithmetic can be used to estimate process parameters is when the process is operated predictably. When a process is operated unpredictably “the process parameters are changing and are therefore divorced from the statistics” used to calculate them. (Wheeler, More Capability Confusion, (Quality Digest, May 2017), 2).
It is for the above reasons that the Process Capability Indices should always be reported with the additional context of a process behavior chart and a capability histogram. The process behavior chart will characterize process behavior as predictable or unpredictable. In doing so, it reveals the voice of the process. The capability histogram will visualize the relationship between the specification limits (space available) and the process data. In doing so, the capability histogram reveals the relationship between the process data and the voice of the process.
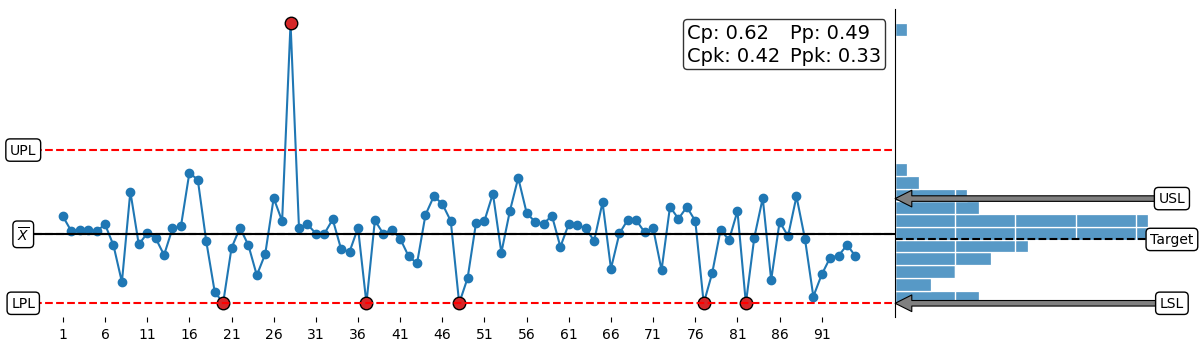
Figure 6. The X chart portion of an XmR chart (left) and the associated capability histogram (right).