

Tolerance
The tolerance defines the acceptable range within which performance or quality characteristics may vary, thereby defining the space available. To calculate the tolerance, subtract the Lower Specification Limit (LSL) from the Upper Specification Limit (USL) using the formula:

The relationship between the tolerance and a dataset of electrical resistance measurements is shown in Figure 1. Here, the USL is 5,295 MΩ; the LSL is 3,395 MΩ; and the tolerance associated with these limits is 1,900 MΩ. Measurements that fall inside the specification limits (tolerance) are conforming, while those that fall outside are nonconforming. With a distribution that is wider than the specification limits, the process in Figure 1 is producing both conforming and nonconforming product. Thus, the space available to the process is less than the space used in the past.
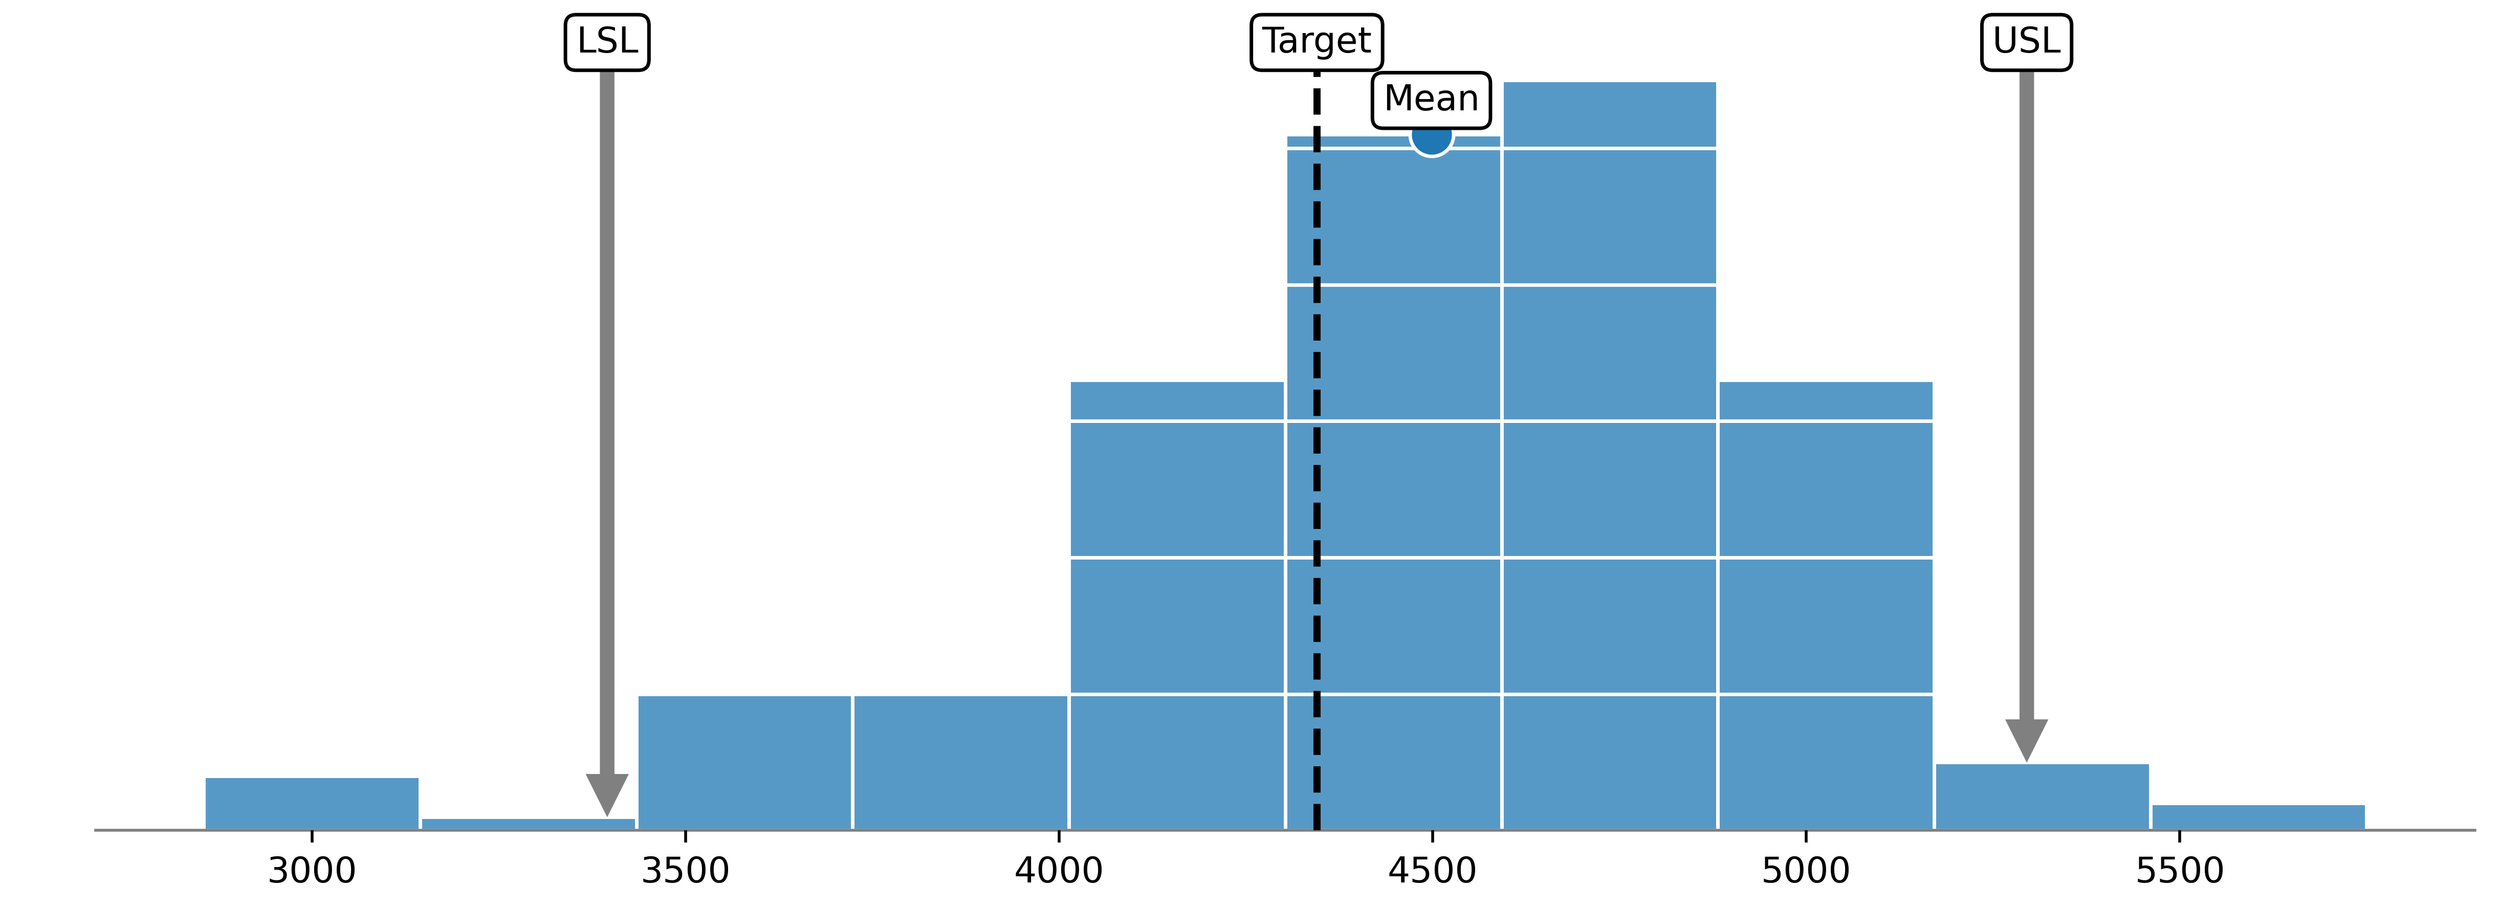
Figure 1. Capability histogram showing the specification limits (tolerance), target, and mean of the distribution.
To improve this process the underlying causal system must be characterized as either predictable or unpredictable using process behavior charts. If the process is characterized as unpredictable, assignable causes of exceptional variation must be eliminated. If the process is characterized as predictable, only common causes of routine variation influence process behavior. To reduce the influence of common causes new technology, new equipment, new materials, or new procedures must be introduced.
A word of warning
Producing parts within tolerance (in spec) is generally considered good enough. This kind of thinking imbues the measured characteristics of parts and processes with the same level of uniform quality. This is epitomized by the square loss function shown in Figure 2. Here, values near the specification limits have the same quality as values near the target. Only when a value falls outside of the specification limits is the loss due to poor quality incurred. This antiquated way of thinking dates back to the earliest days of the industrial revolution. This hinders progress and improvement by establishing the specification limits as goal posts. Rather than aim to produce parts on-target with minimum variance, the aim of goal post thinking is to kick between the goal posts and be done.
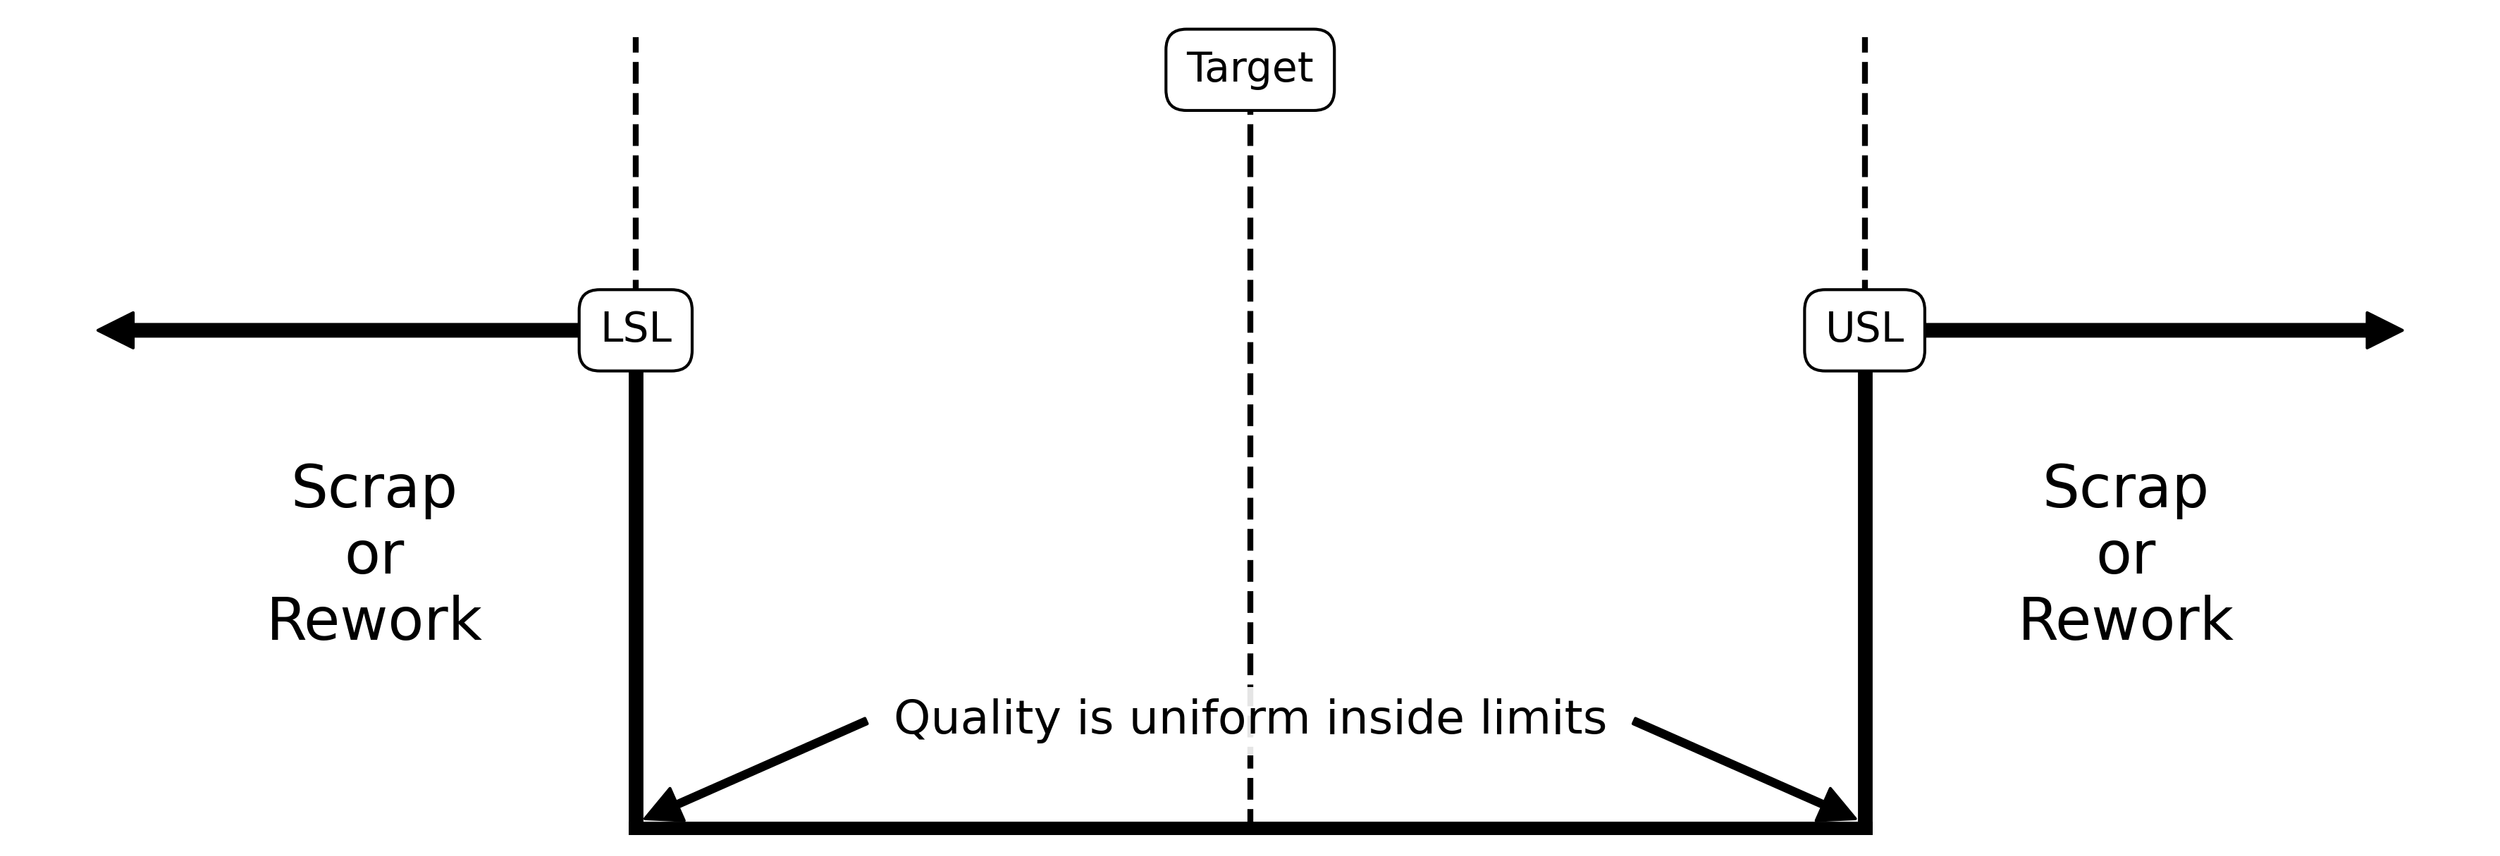
Figure 2. Square loss function.
To avoid the trappings of a good enough, a new way of thinking is required. Luckily, this new way of thinking already exists. In September 1960, Dr. Genichi Taguchi defined world-class quality as on-target with minimum variance. This definition of quality governs the space available to a process (the tolerance) with a quadratic loss function like the one shown in Figure 3. Here, measured characteristics that are produced on-target are imbued with the highest quality. The further a characteristic diverges from the target, the larger the loss due to poor quality. This framing moves operations away from chasing good enough and into the realm of continual improvement. Under the Taguchi loss function, the producing parts in spec is the bare minimum.
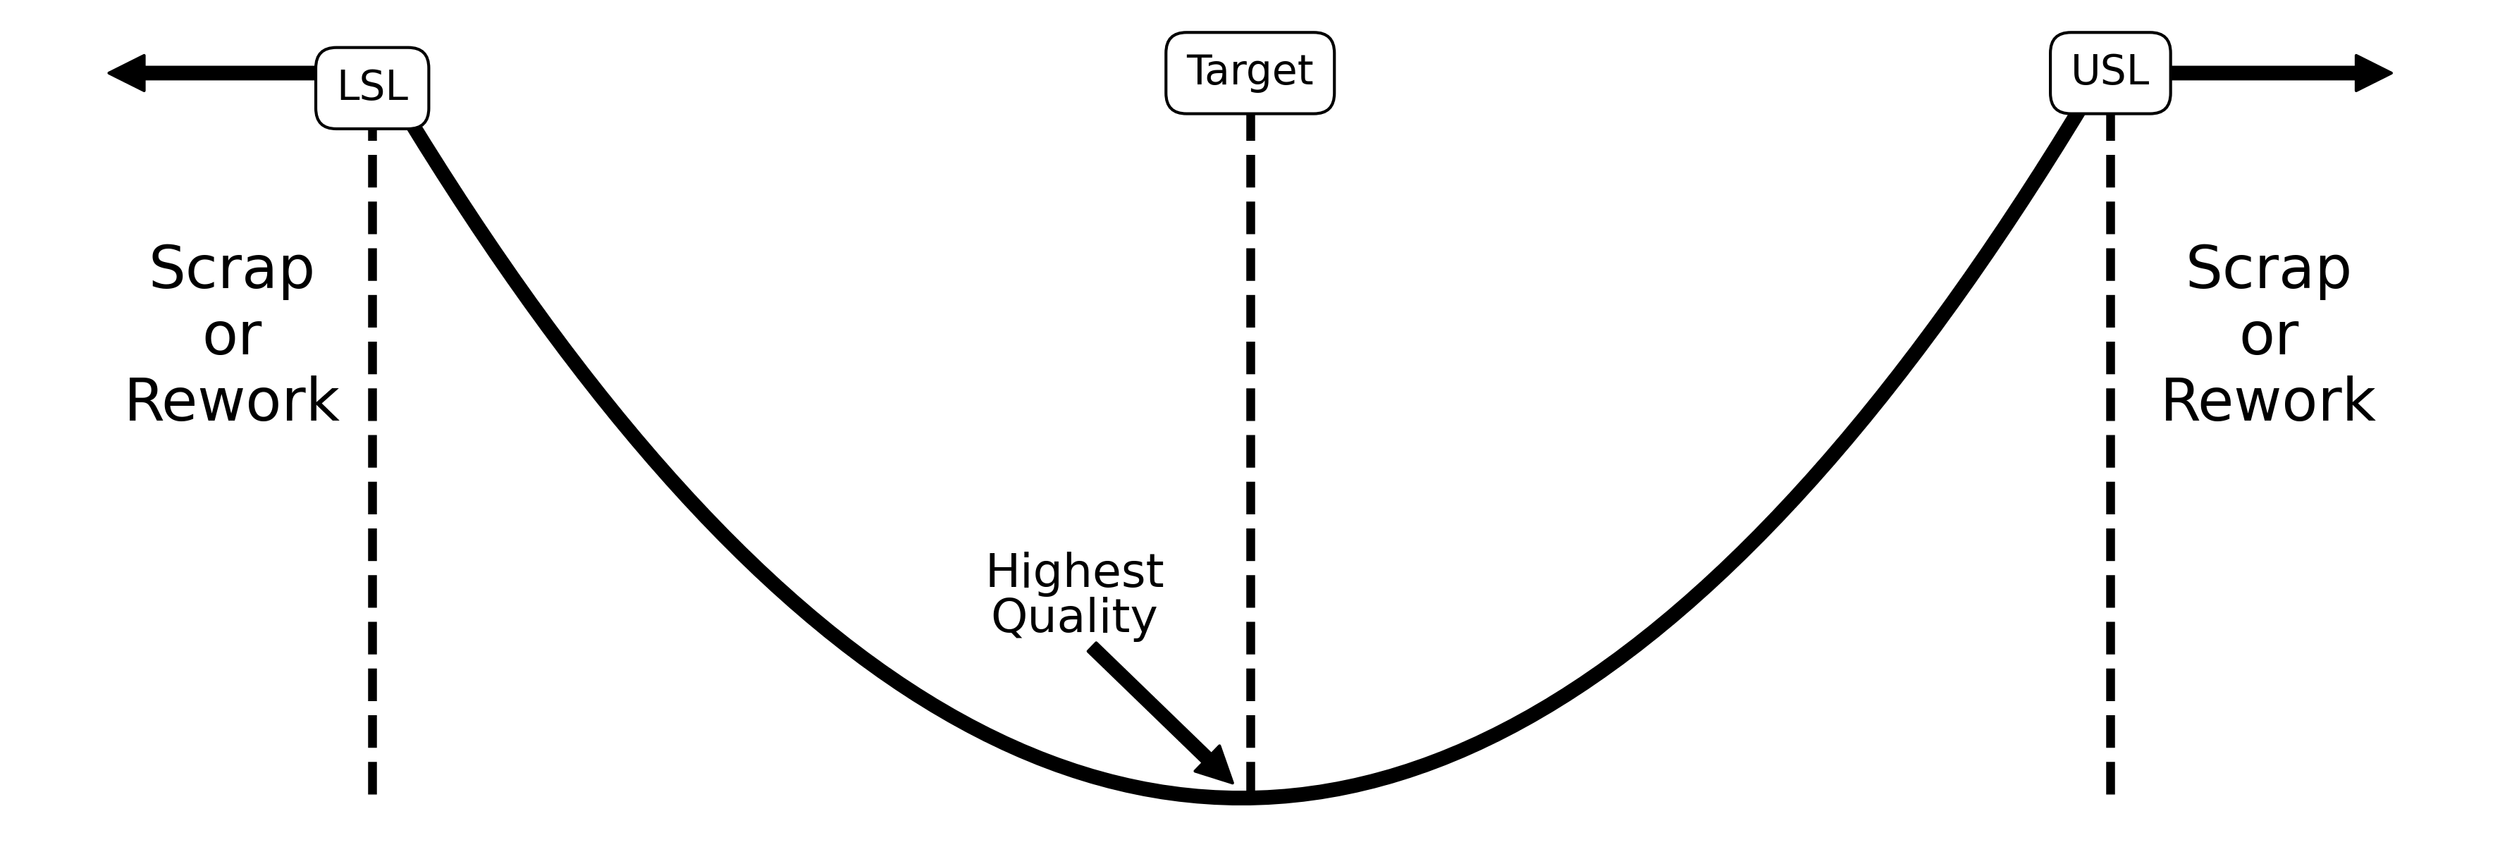
Figure 3. Quadratic loss function