

process_improvement.py
process_improvement.py is a Python library that performs calculations and generates figures that facilitate an understanding of variation in business and manufacturing processes. The primary tool of this library is the process behavior chart (control chart) for individual values and a moving range called the XmR chart. Other functions include:
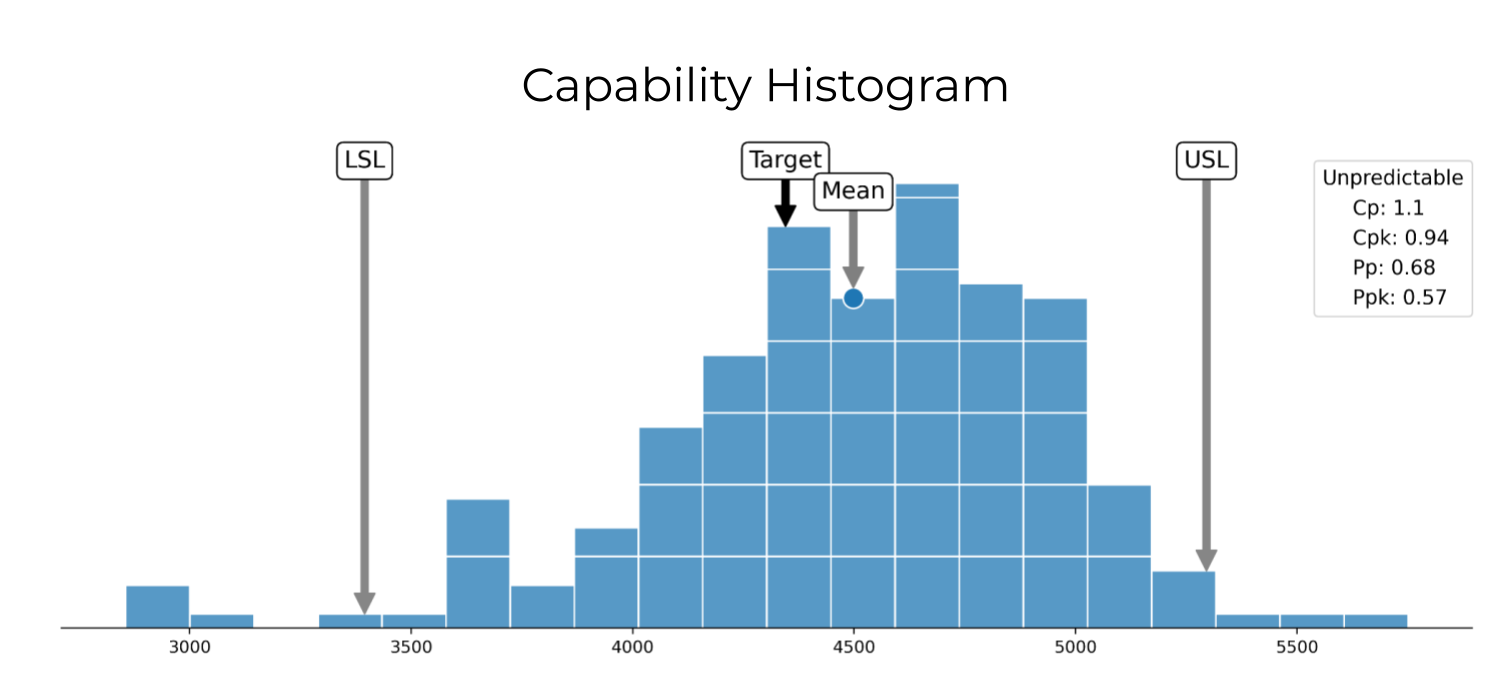
Capability histogram
Process capability index calculations
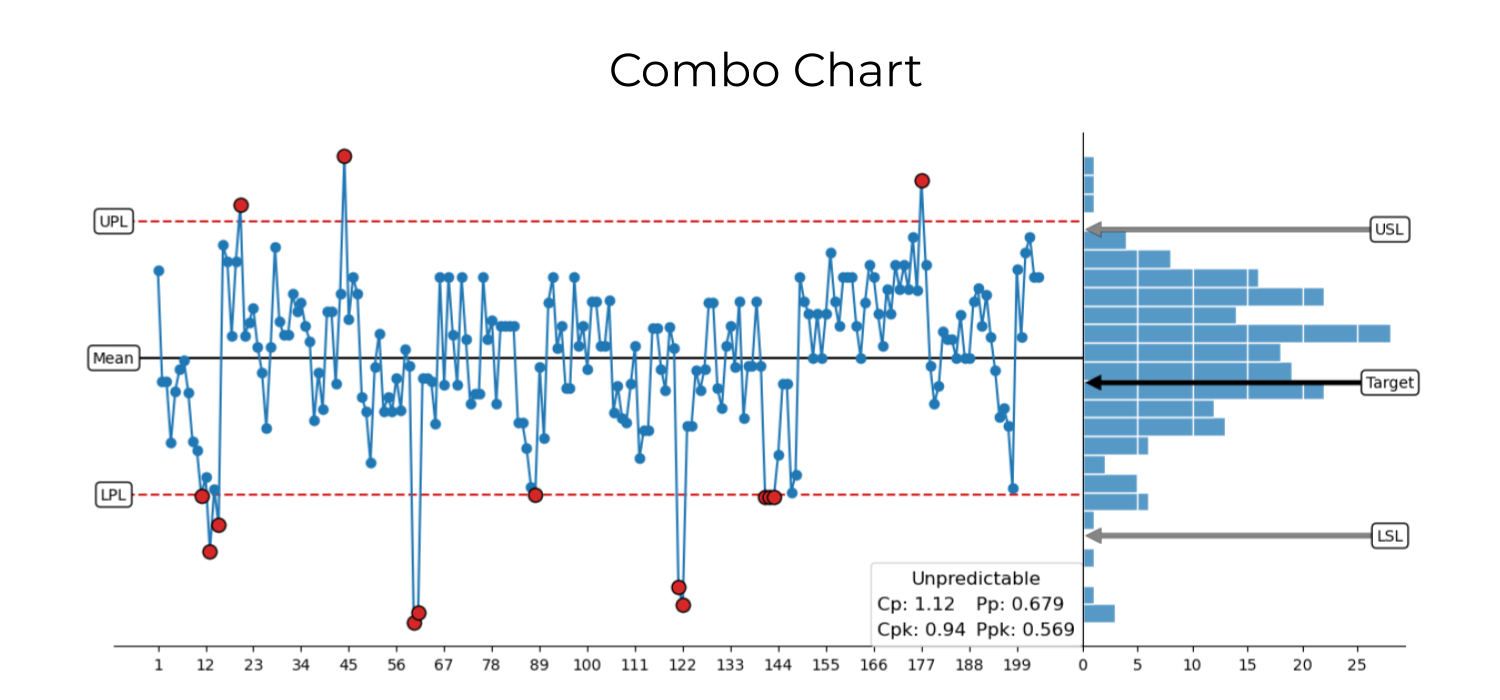
Combo chart
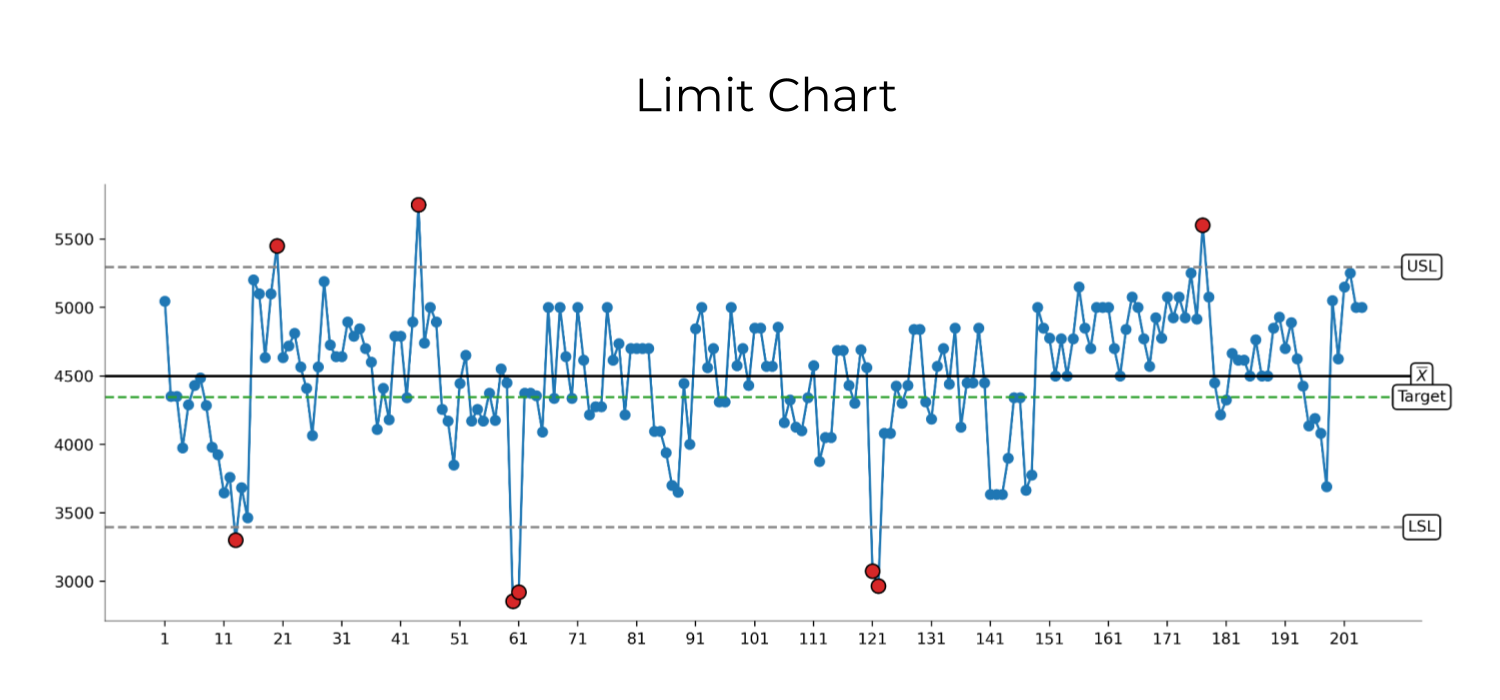
Limit chart
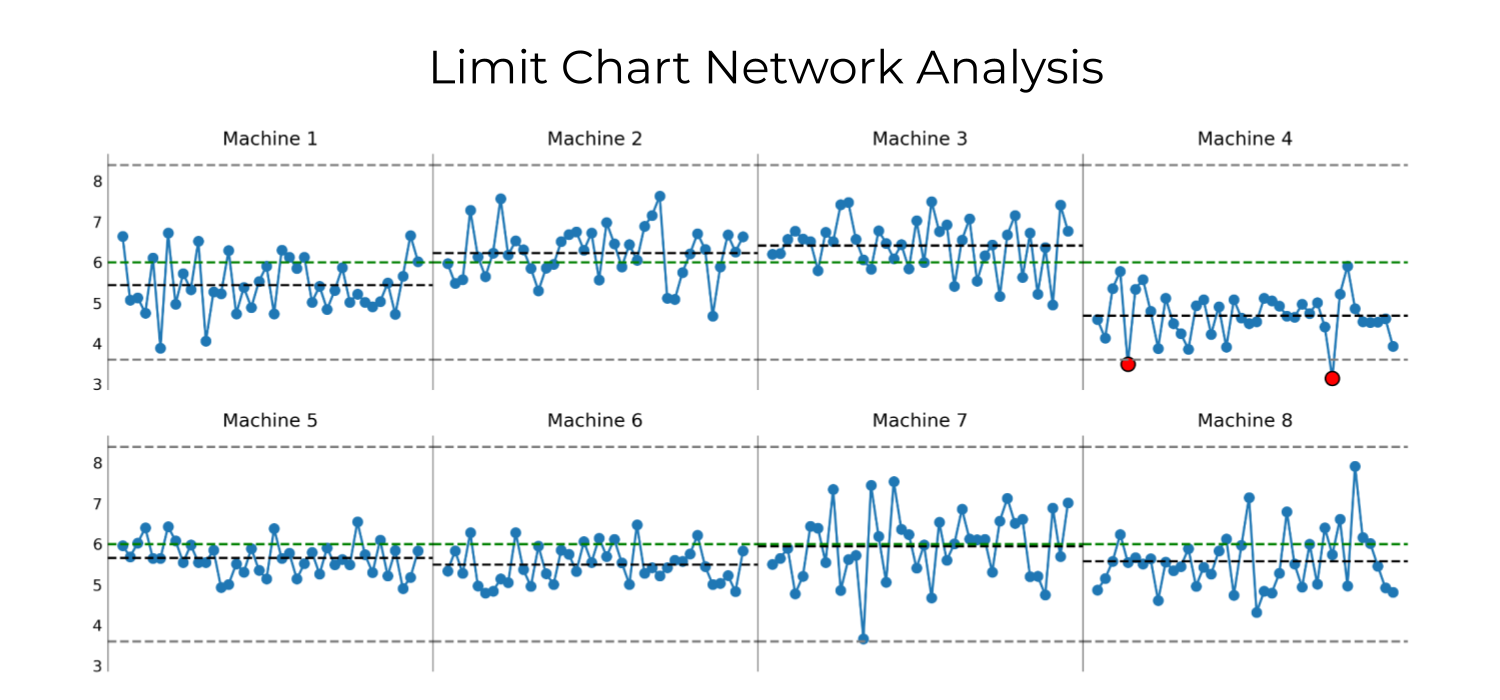
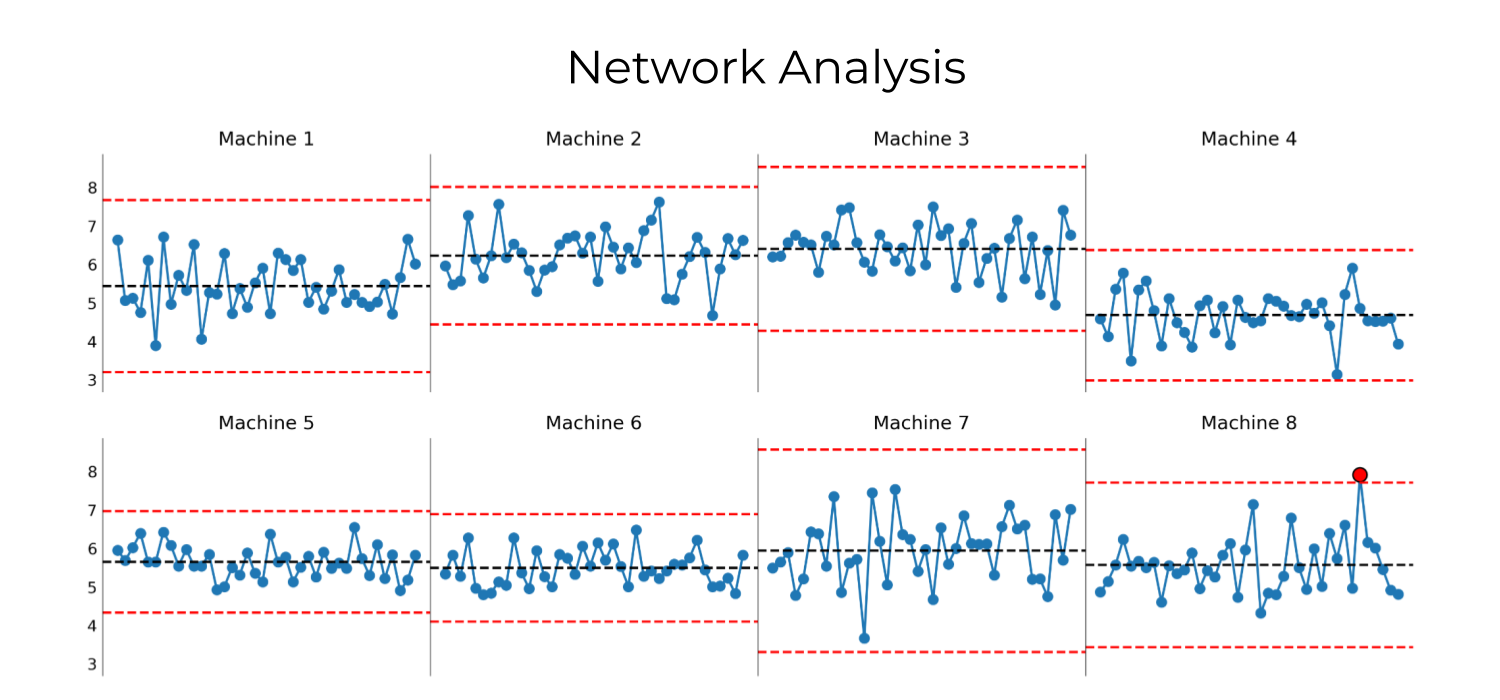
Limit chart network analysis
Network analysis
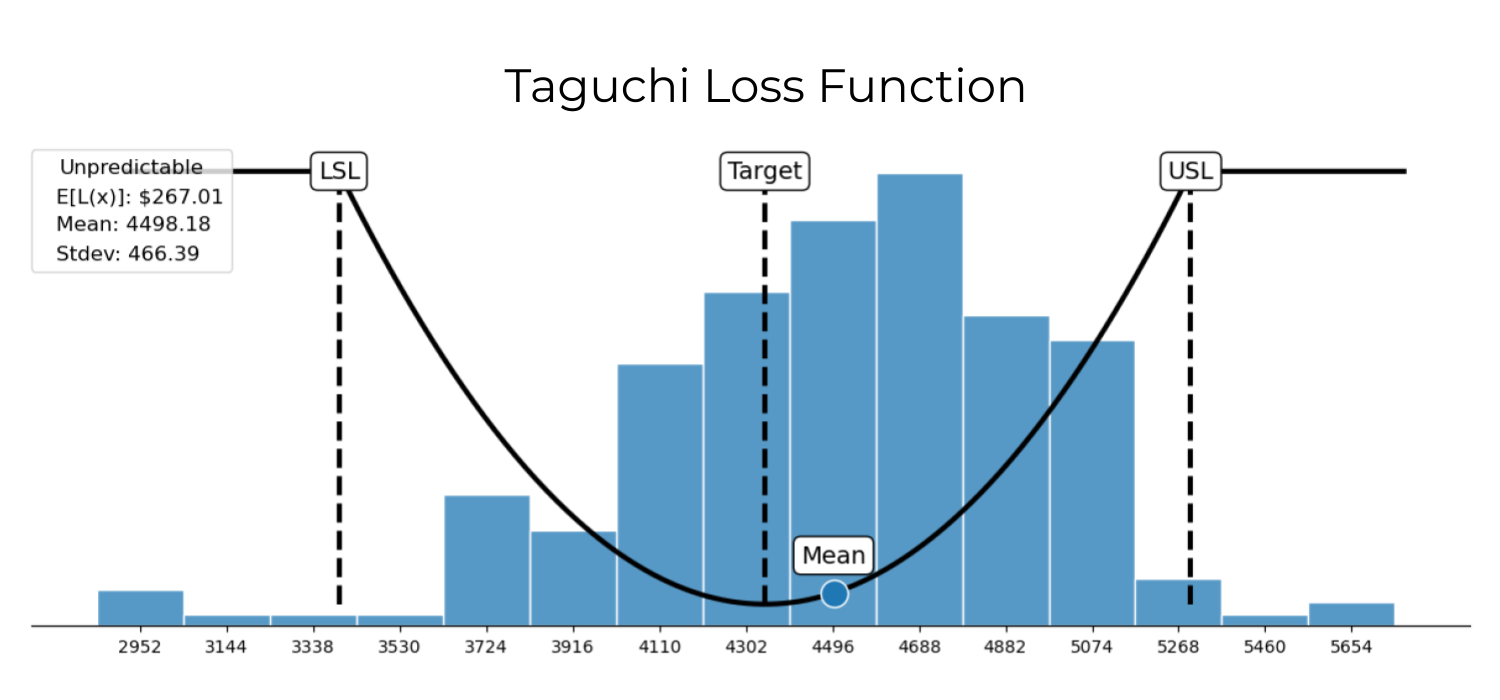
Taguchi loss function
Economic loss due to poor quality calculation
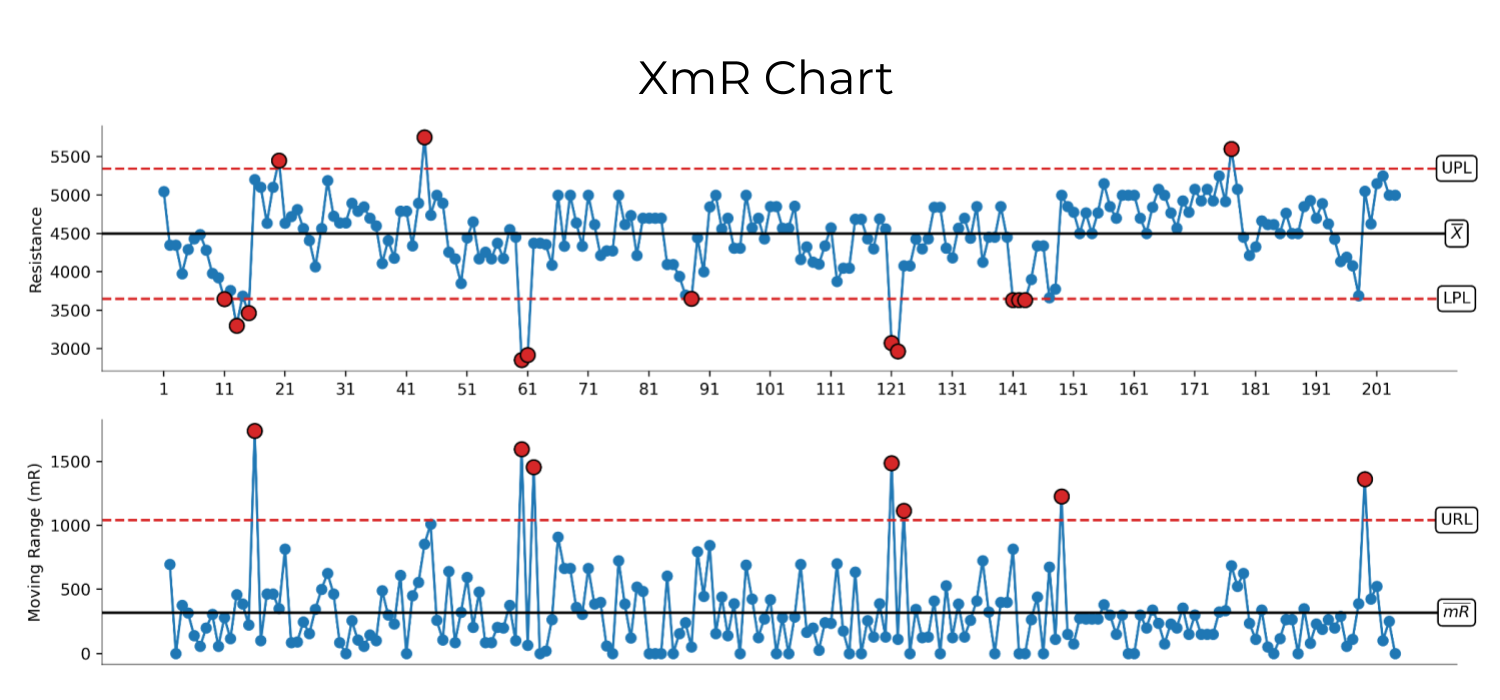
XmR chart
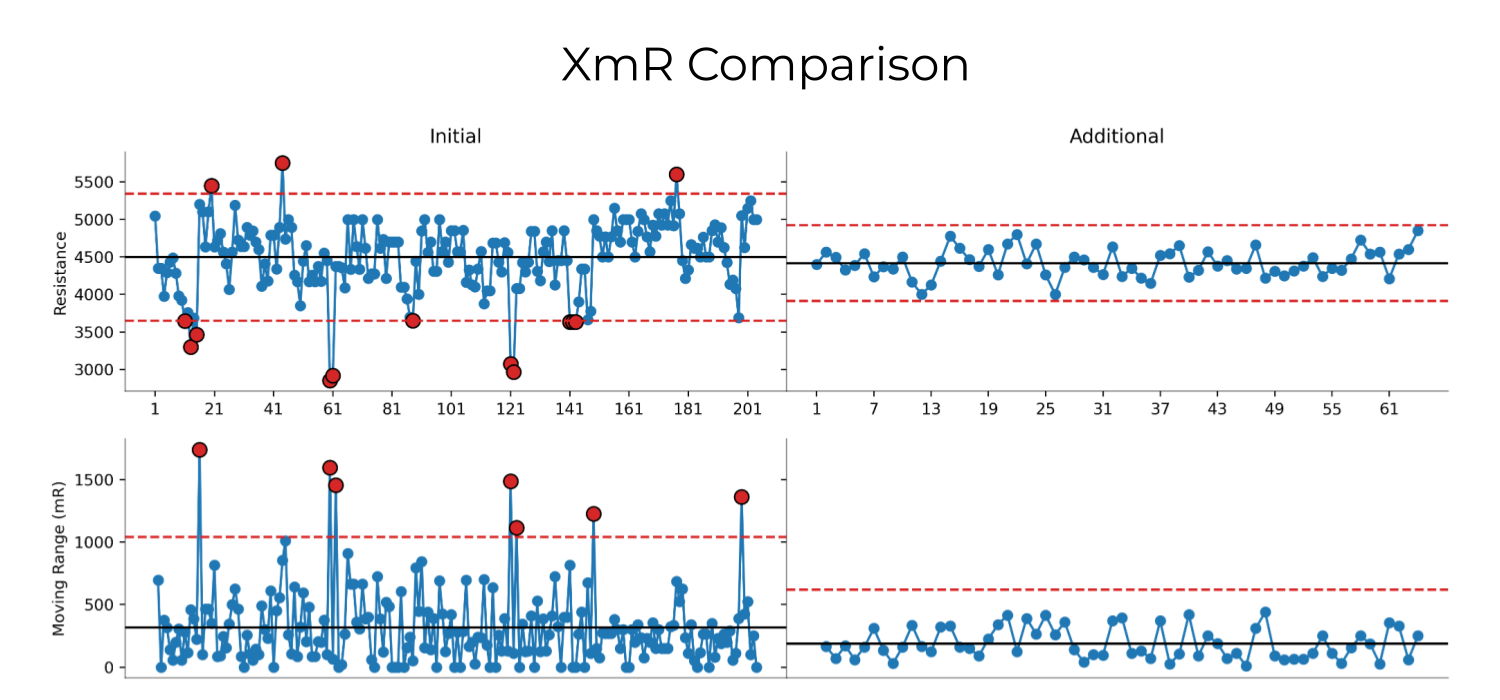
XmR chart comparison
To learn more about these functions visit the GitHub repository: GitHub.com/jimlehner/process-improvement.
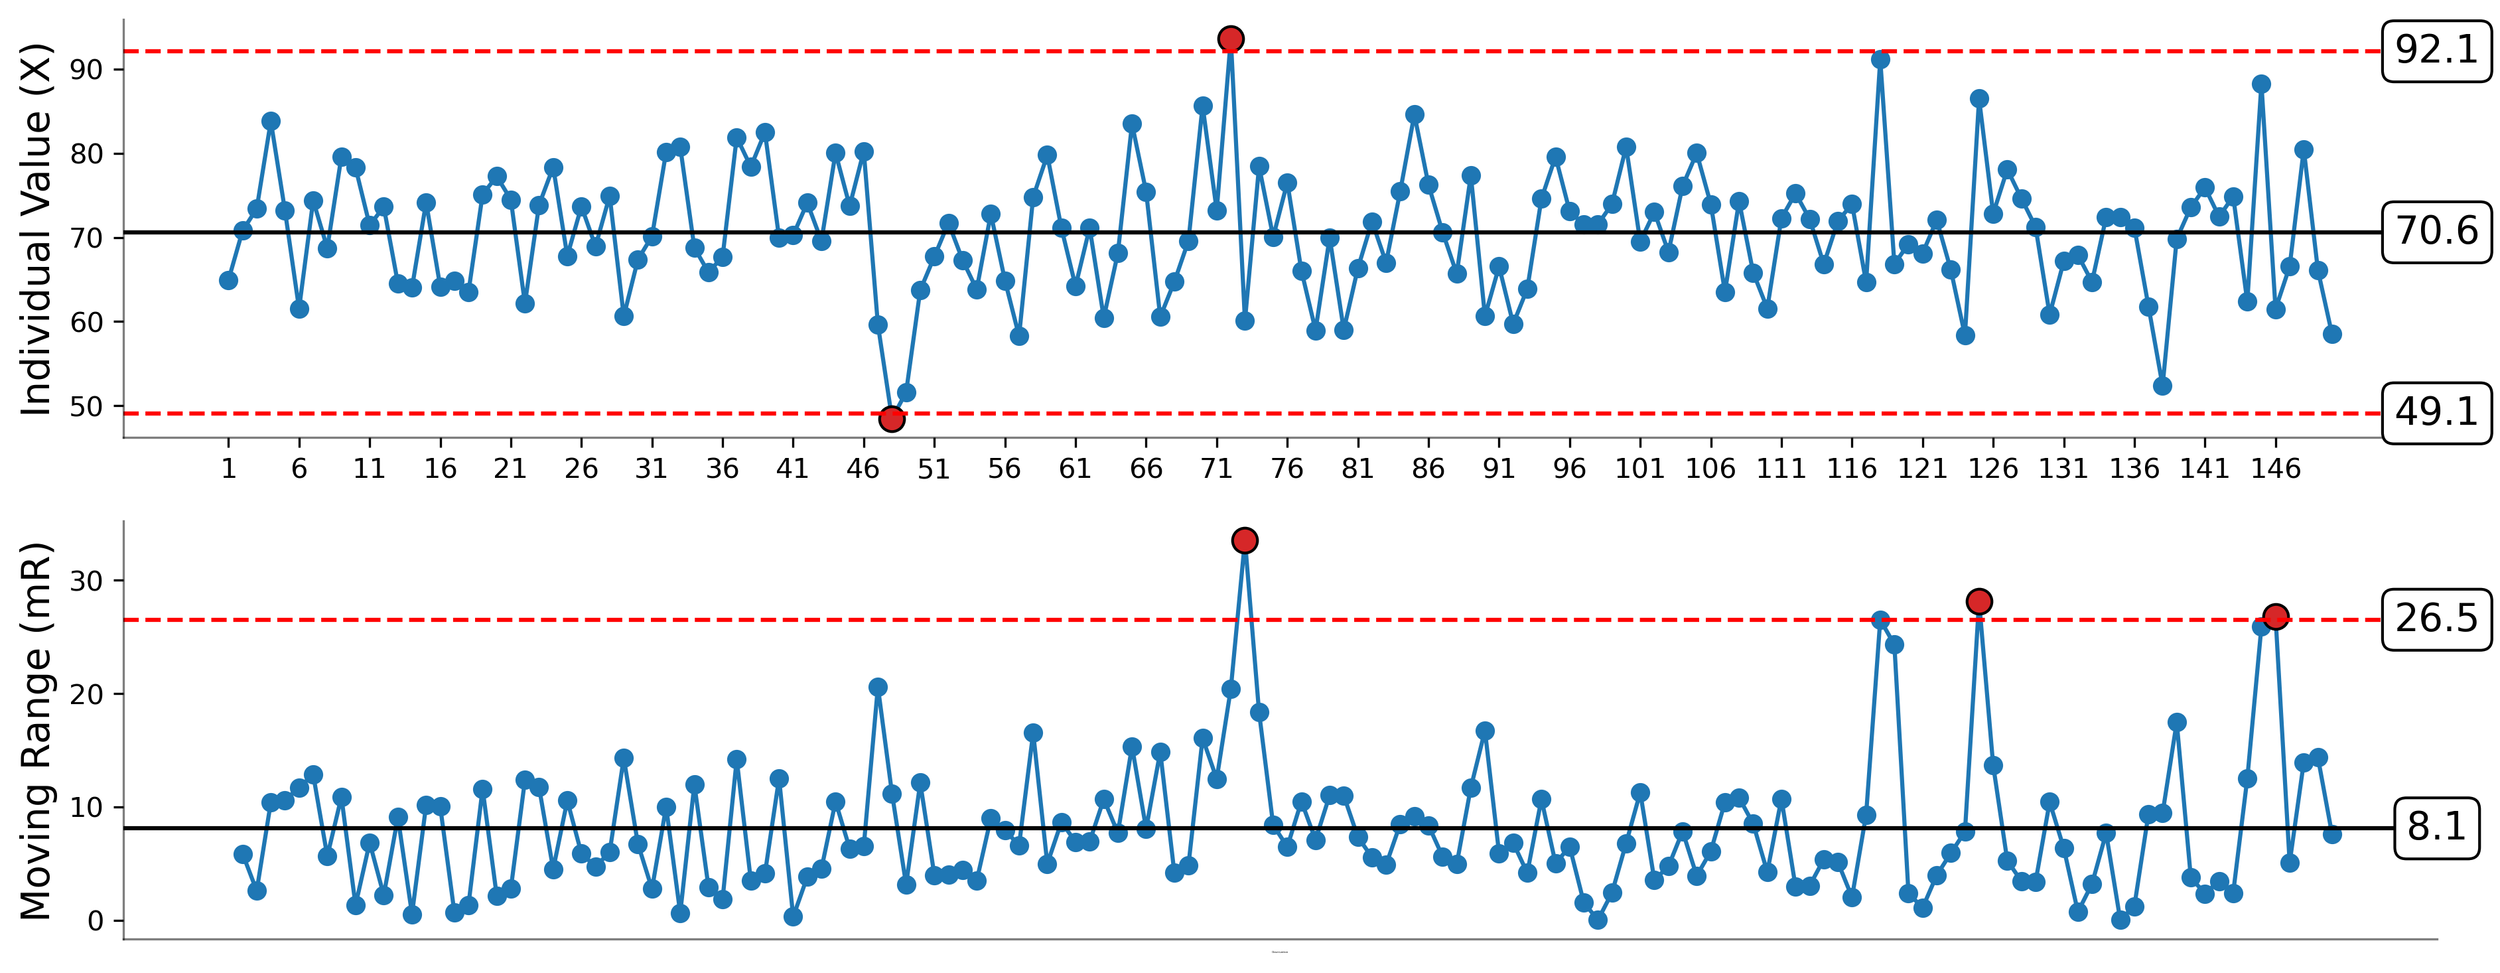
Figure 1. XmR chart of electrode overhang.
Table of contents
Installation
The library is hosted on PyPi.org, thus it can be installed via pip using the command:
pip install process-improvement
Alternatively, the library can be installed from GitHub using the command:
pip install git+https://github.com/jimlehner/process_improvement.py
Additional information
Parts of an XmR chart: Invented by Dr. Walter Shewhart in the mid-1920s at Bell Telephone Laboratories, PBCs are composed of two charts: the X-chart and the mR-chart. Where the X-chart bounds the variation associated with individual values the mR-chart bounds the value-to-value variation. This is made possible through the calculation of a trio of limits known as process limits. The upper process limit (UPL) and lower process limit (LPL) are used on the X-chart. The upper range limit (URL) is used on the mR-chart.
Two types of variation: Inherent in the characterizations of
predictableandunpredictableis the type of variation influencing process behavior. A predictable process is influenced by onlyroutinecauses of variation. Anunpredictableprocess is influenced by bothroutine causes of variationandassignablecauses of variation.Improvement:
Predictable: To improve a predictable process
routinecauses of variation must beidentified,understood, andmitigated. This requires fundamental changes to the process must be made. These include, but are not limited to, changes to raw materials, adjustment to system settings, redesign of stations, redesign of software, calibration of measurement systems.Unpredictable: To improve an unpredictable process
assignablecauses of variation must beidentified,understood, andeliminated. To begin this process, an investigation into values that fall outside the process limits on thePBCmust be performed.
For those unfamiliar with process behavior charts (control charts) that are interested in learning more click here.