

Capability Ratio, Cp
The capability ratio, Cp, divides the tolerance by the quantity 6Sigma(X). Thus, it expresses the space available to a process, allotted by the tolerance, as a multiple of the space required when the process is operated on-target and predictably.

The relationship between the space available and the space required is further clarified in Figure 1. Here, a generic distribution of individual values is shown in the context of the specification limits (the space available) and the process limits (the space required). Note that the process limits shown in Figure 1 are calculated using Shewhart’s generic formula, Average ± 3Sigma(X), where Sigma(X) is a generic placeholder for one of several within-subgroup measures of dispersion. This is the same Sigma(X) used in the denominator of the capability ratio.
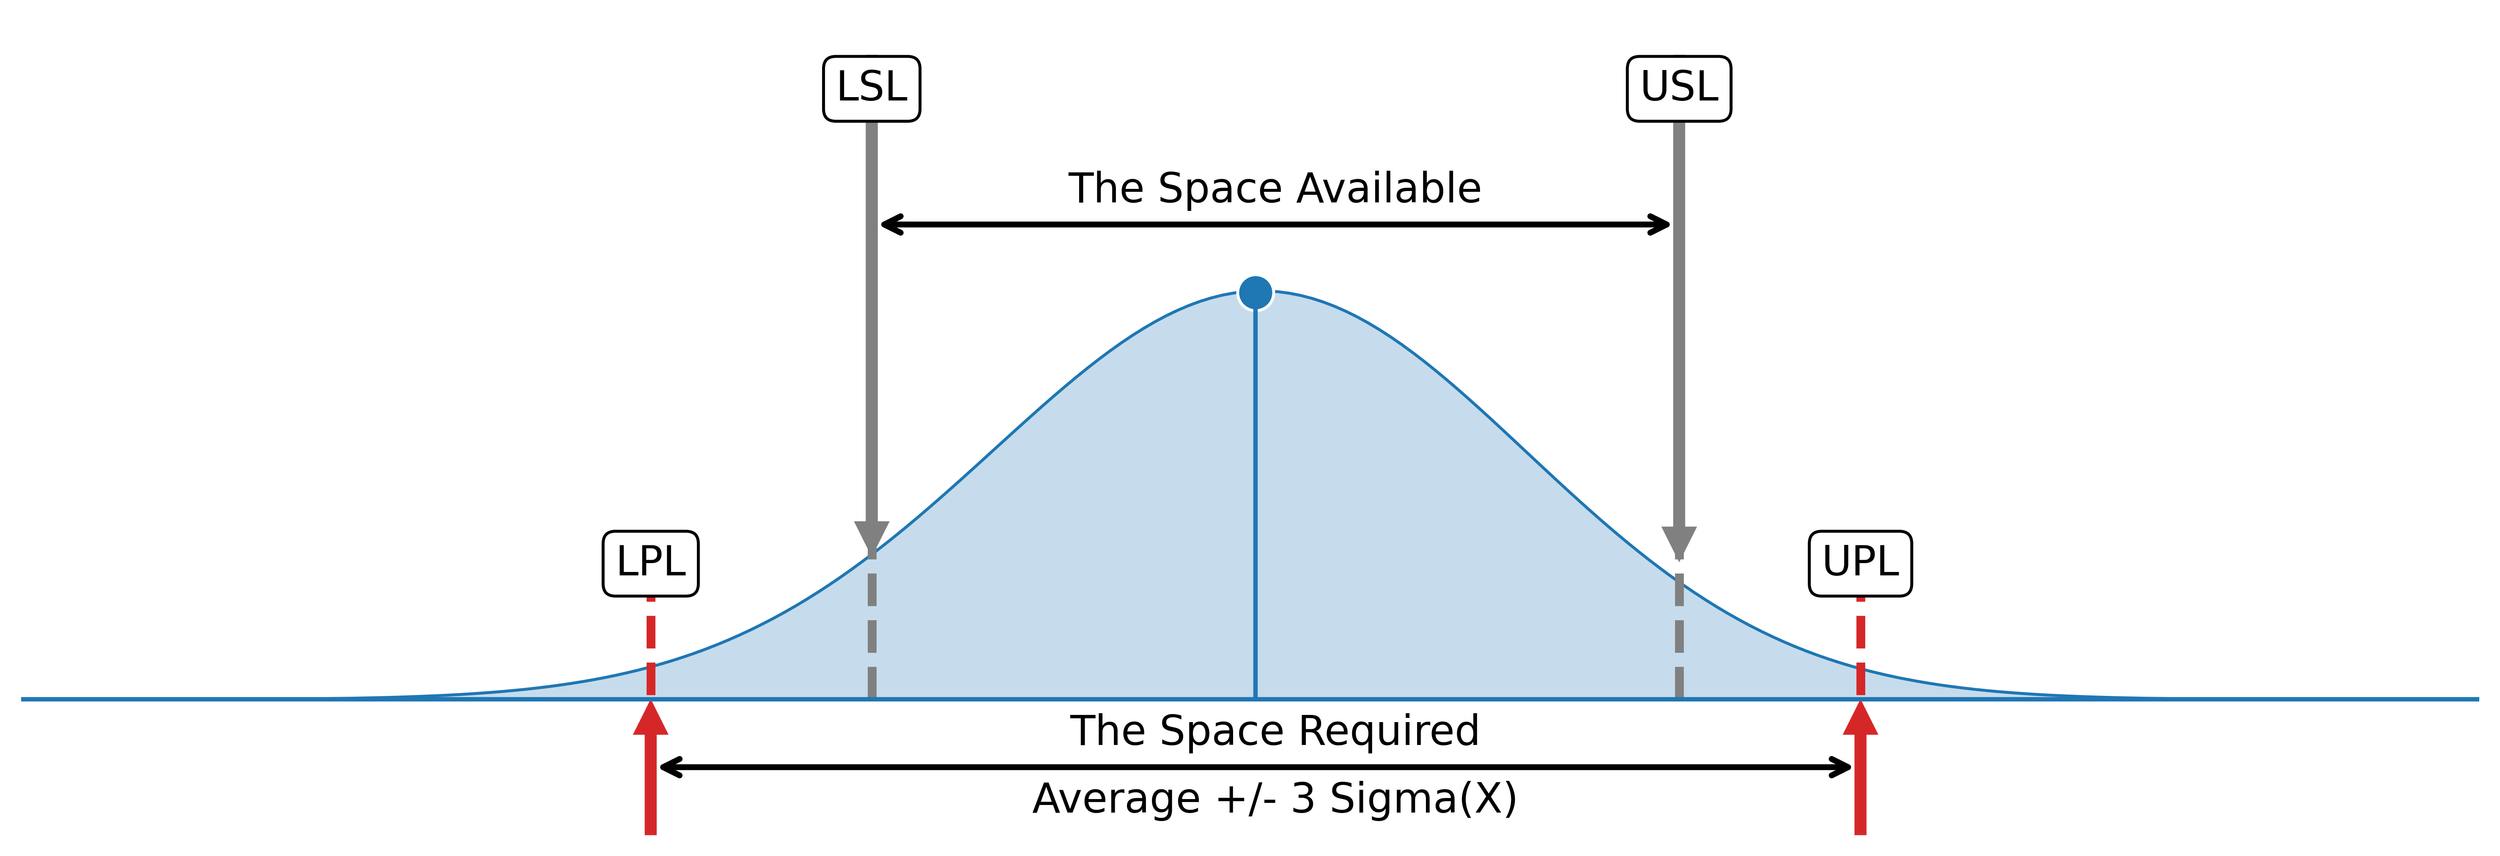
Figure 1. The relationship between the space available and the space required.
By way of integrating the specification limits into its calculation, the capability ratio can be thought of as characterizing the elbow room of a process. When the difference between the specification limits is large, i.e. the tolerance is large, elbow room increases. When the difference between the specification limits is small, i.e. the tolerance is small, elbow room decreases.
While elbow room provides us with an easy way to relate the space available to the space required, it does not account for how centered a process is within the specification limits. It is for this reason that the capability ratio is typically paired with the centered capability ratio, Cpk.
*The term elbow room originates from the work of the statistician and quality control expert Donald J. Wheeler.
A word of warning
The capability ratio, like all process parameters, is not well-defined until the underlying causal system is operated predictably. Whenever a process is operated unpredictably, that is it is influenced by both common causes of routine variation and assignable causes of exceptional variation, the process parameters, including the process mean, the process standard deviation, and the process capability indices, will change over time. While we can always compute statistics regardless of the characterization (predictable or unpredictable), the only time this arithmetic can be used to estimate process parameters is when the process is operated predictably. When a process is operated unpredictably “the process parameters are changing and are therefore divorced from the statistics” used to calculate them (Wheeler, More Capability Confusion, 2).
It is for the above reasons that the process capability indices should always be reported with the additional context of a process behavior chart and a capability histogram. The process behavior chart will characterize process behavior as predictable or unpredictable and, in doing so, reveal the voice of the process. The capability histogram will visualize the relationship between the specification limits (tolerance) and the process data. In doing so, the capability histogram reveals the relationship between the process data and the voice of the process.
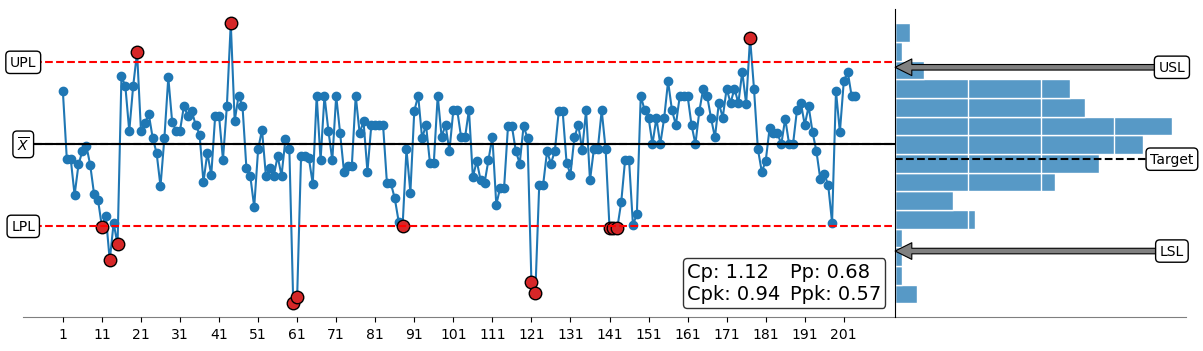
Figure 2. The X chart portion of an XmR chart (left) and the associated capability histogram (right).