

The Cost of Variation is Higher than you Think
It is an inconvenient fact of manufacturing that no matter how hard we try, the sequential outputs of processes are subject to some degree of difference. That is, no two things produced by the same process will ever be the same. Whether we like it or not, variation always asserts an influence.
As important as this fundamental principle may be, education and industry reliably overlook it. Instead of accepting variation as the framework within which all manufacturing takes place, an overly simplified model is used. This model applies 18th century logic to 21st century efforts. It deems anything that falls inside the specification (spec) limits as “good” and anything that falls outside the spec limits as “bad.” This reduces manufacturing to a binary model of “good enough” that is epitomized by the rectangular loss function shown in Figure 1.
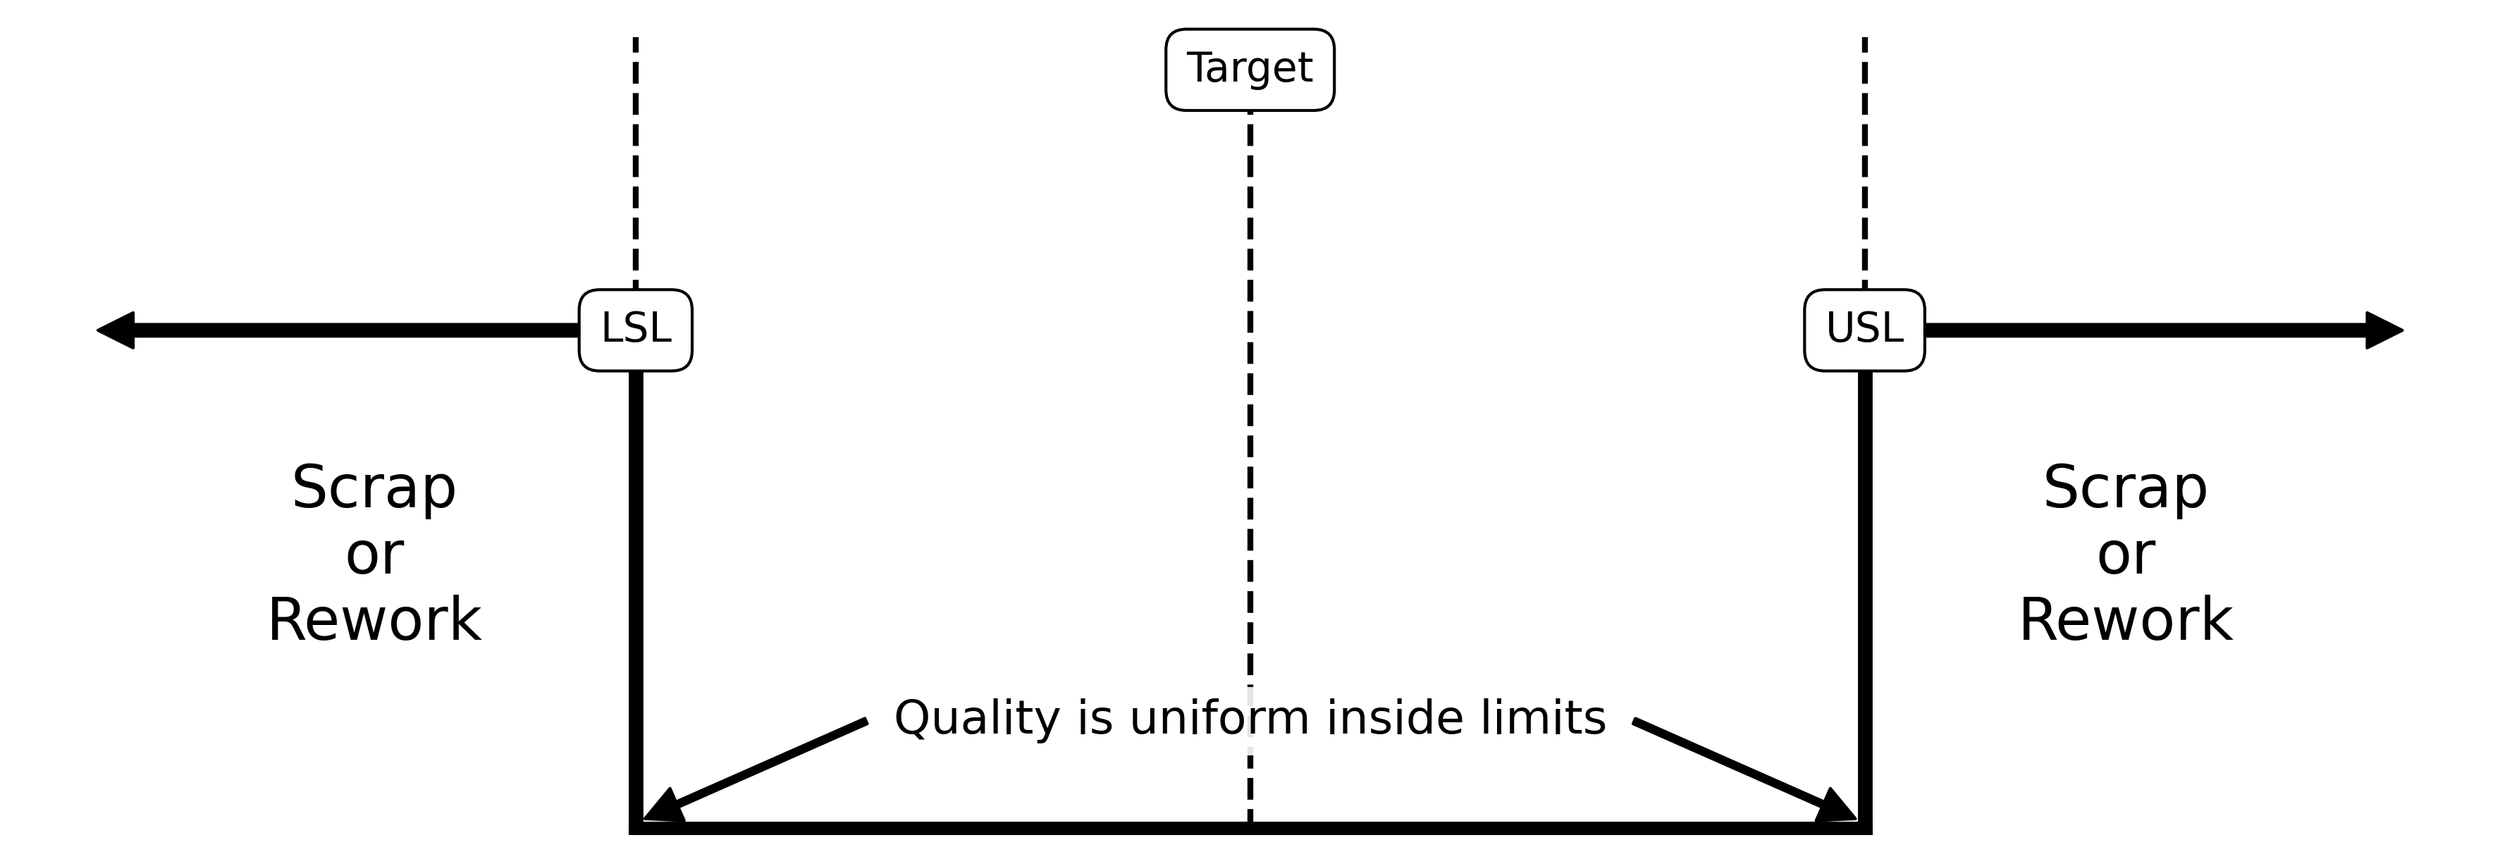
Figure 1. A square loss function deems everything inside of the specification limits “good” and everything outside of the specification limits “bad.”
While the binary model of “good enough” is thought to be, well, good enough, it is a relic of the past that has no place in modern manufacturing. The volume and scale of today’s production processes and the data that they produce make “good enough” a liability. It spawns opportunities for processes to produce scrap and encourages the practice of “fire fighting” that consumes time and resources, often with nothing to show for it.
The Cost of Variation is Higher Than You Think
Every defect, delay , and rework event in your operation has a root cause— and it’s almost always a product of uncontrolled process variation.
Scrap & Rework Costs
Uncontrolled variation produces out-of-spec parts — a direct, measurable hit to your margins.
Quality Escapes
Uncontrolled variation sends defects to customers, damaging trust and triggering costly returns.
Erratic throughput
Unpredictable processes make scheduling, capacity planning, and on-time delivery nearly impossible.
Firefighting Culture
Without a data-driven, repeatable framework, teams react to noise instead of signals.
Services
The practice of “good enough” manufacturing does not need to continue. A future in which processes produce products of world-class quality is within reach and why The Broken Quality Initiative was created.
Is the cost of poor quality too high? We can help!
Want to make sense of production data? We can help!
Need to improve supplier quality? We can help!
Tired of scrap and rework? We can help!
Missing delivery targets? We can help!
Tired of fire-fighting? We can help!
We teach the theory and practice that is foundational to understanding variation. In doing so, we help organizations reduce costs and improve quality in ways that those who subscribe to “good enough” can only dream.

Our one day Understanding Variation course teaches the theory and practice that makes operating your processes at their full potential (high yield & low cost) possible.
Higher Education Partnerships
The “good enough” approach to manufacturing endures because it is the method that is learn in industry and overlooked by higher ed. To put an end to this, we are looking for higher education partners that will help us advance the theory and practice that governs modern manufacturing.
Process Characterization & Improvement
Working with your team, we will investigate and characterize the current state of your manufacturing processes and establish a path forward that reduces costs and improves quality.
Training
Higher Education Partnerships
Professional speaking engagements and guest lectures on topics including process improvement, Statistical Process Control (SPC), the definition of quality, data-driven improvement, and manufacturing as science.
Email QualityIsBroken@gmail.com for details about our services.
The Framework
A systematic, reproducible method that is product, process, and industry agnostic.
Assess
Establish a baseline
Collect and analyze process data to characterize the current state: predictable or unpredictable. Document findings.
Investigate
Perform detective work
Contextualize the findings of the baseline by spending time with the process. See the process in action. Talk to the people that do the work.
Improve
Target sources of variation
Sequentially implement changes that mitigate common causes or eliminate assignable causes.
Control
Lock in the gains
New process knowledge, control plans and trained personnel keep the process predictable after our engagement ends.
The framework used by The Broken Quality Initiative is product, process, and industry agnostic. This means that, regardless of what you’re manufacturing, we can help you increase yield and lower costs. Whether its jet engines, batteries, catheters, electrical connectors, insulin pumps, electric aircraft, automated manufacturing lines, or anything in between, our method for understanding variation has proven itself for more than a century (click here to learn more).
To learn more about the BQI framework email QualityIsBroken@gmail.com for details.
The Tool - The Process Behavior Chart
The key to managing the chaos of manufacturing and predicting future process behavior.
Process Behavior Charts (PBCs) characterize process behavior as either predictable or unpredictable, directing time and attention to where they are needed most.
Improvement of a predictable process requires reengineering via the introduction of new technology, equipment, materials, and procedures.
Improvement of an unpredictable process requires assignable causes of exceptional variation be eliminated.
This distinction is the key to reducing costs and improving quality — it is the difference between acting on noise and making no progress or ignoring signals and perpetuating problems.
Common Causes of Routine Variation
Many in number but small in effect, common causes yield predictable process behavior. When necessary, mitigating common causes requires reengineering.
Assignable Causes of Exceptional Variation
Few in number but dominant in effect, assignable causes yield unpredictable process behavior. These must be found and permanently eliminated.
Process Behavior Charts
The roadmap for reducing costs & improving quality PBCs reveal what your process has done in the past, what it will do in the future, and what must be done to realize improvement.
“A phenomenon will be said to be controlled when, through the use of past experience, we can predict — at least within limits — how the phenomenon will behave in the future."
Walter A. Shewhart, Father of PBCs