

About the BQI
The Broken Quality Initiative teaches engineers how to reduce costs and improve quality by understanding variation. We do this by combining the theory that governs all manufacturing processes with the tools that make the invisible world of variation visible. These two domains form a framework that makes rapid learning and rapid improvement of manufacturing (and business) processes possible.
At the core of The Broken Quality Initiative framework are two seminal contributions: the definition of world-class quality introduced by Dr. Genichi Taguchi, and the process behavior chart invented by the physicist Walter A. Shewhart in the mid-1920s.
In September 1960, Dr. Taguchi defined world-class quality as
“On-target with minimum variance.”
Operating a process “on-target” requires a new way of thinking in which the cause-and-effect relationships that influence process behavior take center stage.
Operating a process “with minimum variance” can only be achieved when a process is operated predictably and up to its full potential (i.e., high yield and low cost).
The only way to achieve “on-target with minimum variance” is with the process behavior chart.
Also called a control chart, the process behavior chart is the key that makes managing the chaos of manufacturing possible. By discriminating between the two types of variation, common causes of routine variation and assignable causes of exceptional variation, the process behavior chart allows you to anticipate the future based on the past. With the process behavior chart, new process knowledge is gained and world-class quality can be realized.
“No one gives a hoot about profits—if they did they would be interested in learning better ways to make them.”
— Deming’s First Theorem
How is quality broken?
Conformance to specification has come to define quality as a field and practice. Rather than aim to operate processes on-target with minimum variance—the definition of quality established by Dr. Genichi Taguchi in September 1960—quality, as reflected in ISO 9000:2015 Clause 3.5.1, is defined
as the degree to which a set of inherent characteristics of an object fulfills requirements.
While on its face this definition of quality seems sensible, after all no customer in their right mind will accept product that does not fulfill requirements, it reinforces the perspective that quality is binary. It bolsters the widely held but wrong belief that the measured characteristics of parts, products, services, processes, and systems are either good or bad, conforming or non-conforming.
As a product of this binary view, the quality landscape has been infected with tools, techniques, methods, and fads that are too busy mopping to turn off the water. It has been reduced to efforts that attempt to improve quality and reduce costs with no knowledge of variation and its influence. This results in actions that ignore the reality that variation is always at work. It ensures that defects will be produced and world-class quality will never be achieved.
Quality as a field and practice is broken because it lacks an understanding of variation and the only tool capable of making sense of variation, the process behavior chart. While we will not be able to correct course overnight, it is the aim of The Broken Quality Initiative to continue the campaign to understand variation started by Walter A. Shewhart in the mid-1920s. It is our goal to provide engineers and industry with the knowledge and knowhow that reduces costs and improves quality by understanding variation using process behavior charts (control charts).
“Numerical literacy is not addressed by the traditional courses in the primary or secondary schools, nor is it addressed by advanced courses in mathematics. This is why even highly educated individuals can be numerically illiterate.”
— Donald J. Wheeler, Understanding Variation: The Key to Managing Chaos
How do we fix quality?
Fixing quality specifically, and manufacturing generally, is a single job with two parts: theory and practice.
Theory requires knowledge of variation—specifically, an understanding of the two types of variation: common causes of routine variation and assignable causes of exceptional variation. Without the knowledge of variation, improvement efforts rely on luck rather than analysis. The consequences of this have backed manufacturing and quality into a dead end. Individuals and teams operate in an environment where sometimes things get better and sometimes things get worse, with no understanding of either outcome.
Practice puts the theory of variation to work by doing. It is expressed by spending time with the data-generating process (DGP) and performing detective work. It manifests through the construction of process behavior charts and responding to the insights they reveal. Without practice, the knowledge of variation is useless.
To this end, The Broken Quality Initiative has developed a framework to address the failures of quality and manufacturing as they are practiced today (see Figure 1).
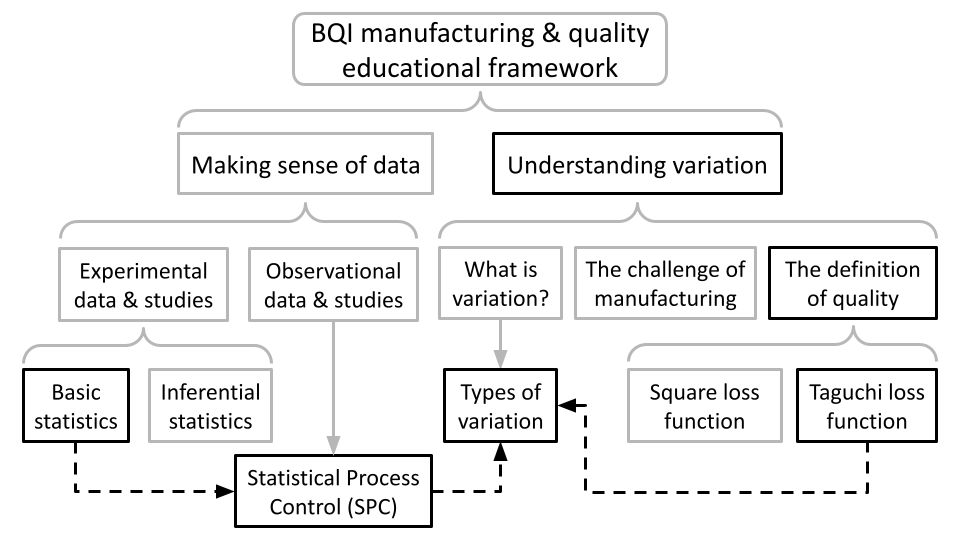
Figure 1. A topical overview of items included in the BQI educational framework with core topics highlighted.
The first leg of this framework teaches students how to make sense of data. This begins by dividing the data landscape into two broad classifications—experimental data and observational data. This distinction leads to discussion about the two types of studies (experimental studies and observational studies) and the way of thinking associated with each. With these distinctions in hand, subsequent discussion explores how the tools of statistics and Statistical Process Control (SPC) are distinct, even though they borrow from each other. It explores how, in the words of American statistician and quality control expert Donald J. Wheeler, “two things sharing a common name can still be different” (Statistics and SPC, 2014).
The second leg of this framework teaches an understanding of variation. It explores seminal questions such as: What is the purpose of manufacturing? What is variation? How do we define quality? These theory focused discussions form a broad framework that can be applied to real world problems. They provide students with a way to think about manufacturing as an effort to produce products that are virtually uniform instead of efforts to meet specifications.
The theory and ideas discussed in the two legs of this educational framework are underpinned by practice. This practice is facilitated by spreadsheet software like Google Sheets and Microsoft Excel, and programming languages like Python. It challenges students to spend time with the DGP and perform detective work. These tools and efforts put students in the proverbial driver seat. They ensure that the new way of thinking cultivated by exposure to theory is reinforced by doing. Without this rubber meets the road approach, the growth and development that comes from doing, failing, refining, and doing again remains out of reach.
The Broken Quality Initiative is always looking for opportunities to partner with educational organizations and speak with students. If you would like to discuss our framework further email us at QualityIsBroken@gmail.com.
Who is the BQI?
The Broken Quality Initiative was founded by Jim Lehner in 2024. A graduate of Worcester Polytechnic Institute (WPI), with an undergraduate degree in Mechanical Engineering and a graduate degree in Manufacturing Engineering, Jim’s professional experience has exposed him to variety of problems in a variety of industries (automotive, aerospace, industrial machining, medical device, defense, healthcare).
Regardless of the problem and regardless of the industry, one underlying truth quickly made itself clear in Jim’s professional journey. If we are to manufacture products of world-class quality we must, first and foremost, understand variation. Without an understanding of variation you are flying blind. You are leaving your success to luck and chance rather than analysis and insight.
But luck and chance cannot reliably and repeatedly produce results. They do not and will not ever combine to form a comprehensive method. To do that requires tools and techniques that allow us to turn data into insights and insights into actions that result in change.
Luckily, for more than a century, a method and tool capable of such a task has helped industry understand and address the virus of variation. That method, understanding variation, and that tool, the process behavior chart (control chart), is how we reliably and repeatedly improve quality and reduce costs. It is how we transform data into insights and insights into actions that result in quantifiable and lasting change.
