

Measures of Location
Used to describe a dataset’s center, measures of location are the tried-and-true statistics of business and manufacturing. Depending on the measure of location, the numerical center of a dataset will be described in different ways. Understanding when to use the different measures of location is fundamental for making sense of data and understanding variation.
Although there are an assortment of numerical summaries that describe a dataset’s center, the focus here will be on the two measures of location most relevant to understanding variation and process behavior charts (control charts). These measures of location, as highlighted in Figure 1, are the mean and the median.
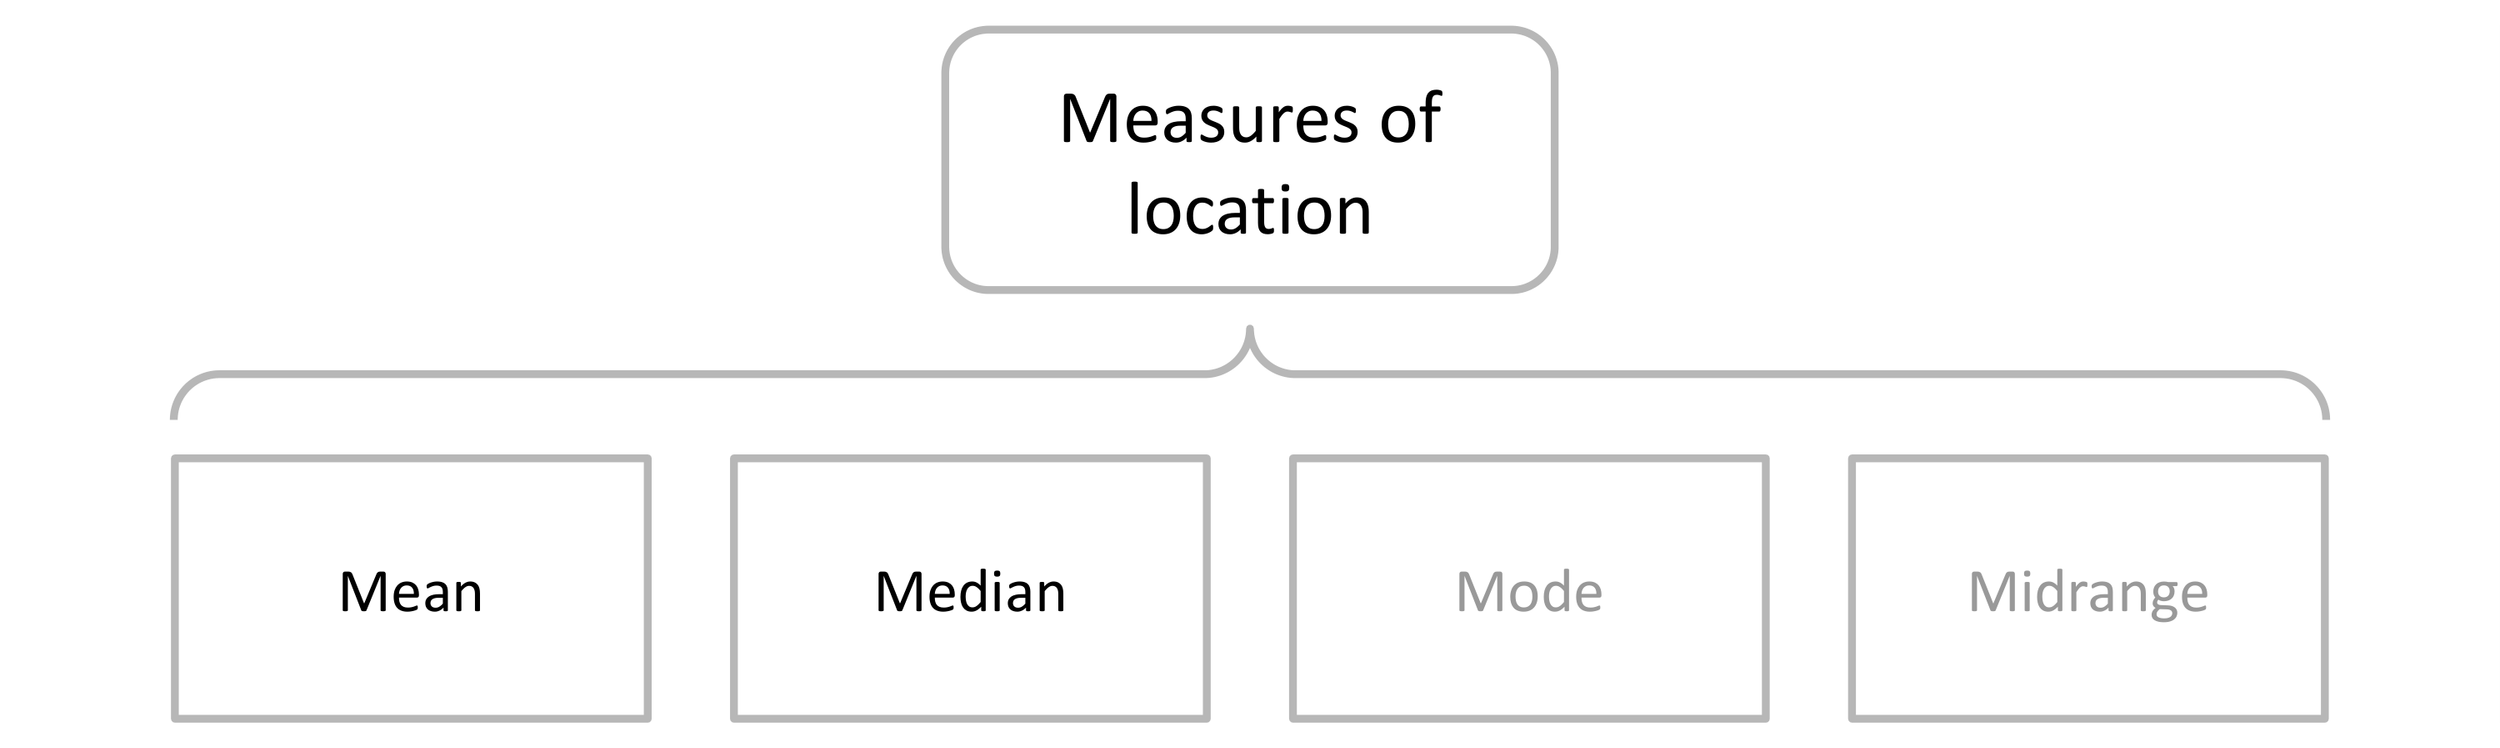
Figure 1. Common measures of location.
Mean
The arithmetic mean, also called the average, is the most widely used measure of location. This prevalence is a function of its simplicity. By dividing the sum of the values in a dataset by the number of values in a dataset, the mean describes a dataset’s center. It reveals a dataset’s typical value.
If we let X denote the individual values in a dataset, the mean of a set of X values can be denoted by placing a bar over the X, creating the symbol X-bar. The formula for the mean is written as:

Here, X-bar is the mean of the dataset, Xn is the nth or last value int he dataset, ∑ denotes the sum of the set of values, Xi is the i-th value in the dataset, and n represents the number of values in the dataset.
As an example, let’s calculate the mean for the 12 annual salaries shown in Table 1.
Yin and Yang
There are both advantages and disadvantages to describing a dataset’s center using the mean. Since all the values in a dataset are included in the calculation, the mean does not account for extreme or dissimilar values. This can be useful in some instances and treacherous in others. The utility depends on the context.
For example, consider again the annual salaries of the 12 employees shown in Table 1. Is describing the typical salary using the mean the appropriate? It depends on your aim.
If trying to describe the typical salary, using the mean is misleading. Why? By way of its calculation, the mean does not account for dissimilar values making it susceptible to their influence. Of the 12 salaries shown in Table 1, 8 are less than the calculated mean of $123,500. Describing the dataset’s center using the mean results in a value that inflates the typical salary. This inflation is primarily driven by the annual salary of the vice president (VP). Because the VP’s salary is significantly greater than all of the others, it exaggerates what is typical. As a result, the description of the dataset’s center is a false representation of the typical salary.
Figure 2. Bar chart of annual salaries and the associated mean.
Alternatively, if trying to convey the impact of different salaries on department expenses, the mean becomes an illuminating choice. The inflation that occurred due to the VP’s salary now becomes evidence of its impact.
Different insights into a dataset are highlighted by different numerical summaries. But these insights can only be revealed with an understanding of what each summary represents. When trying to describe the typical annual salary, you’ll want to use a measure of location that is less sensitive to extremes like the median
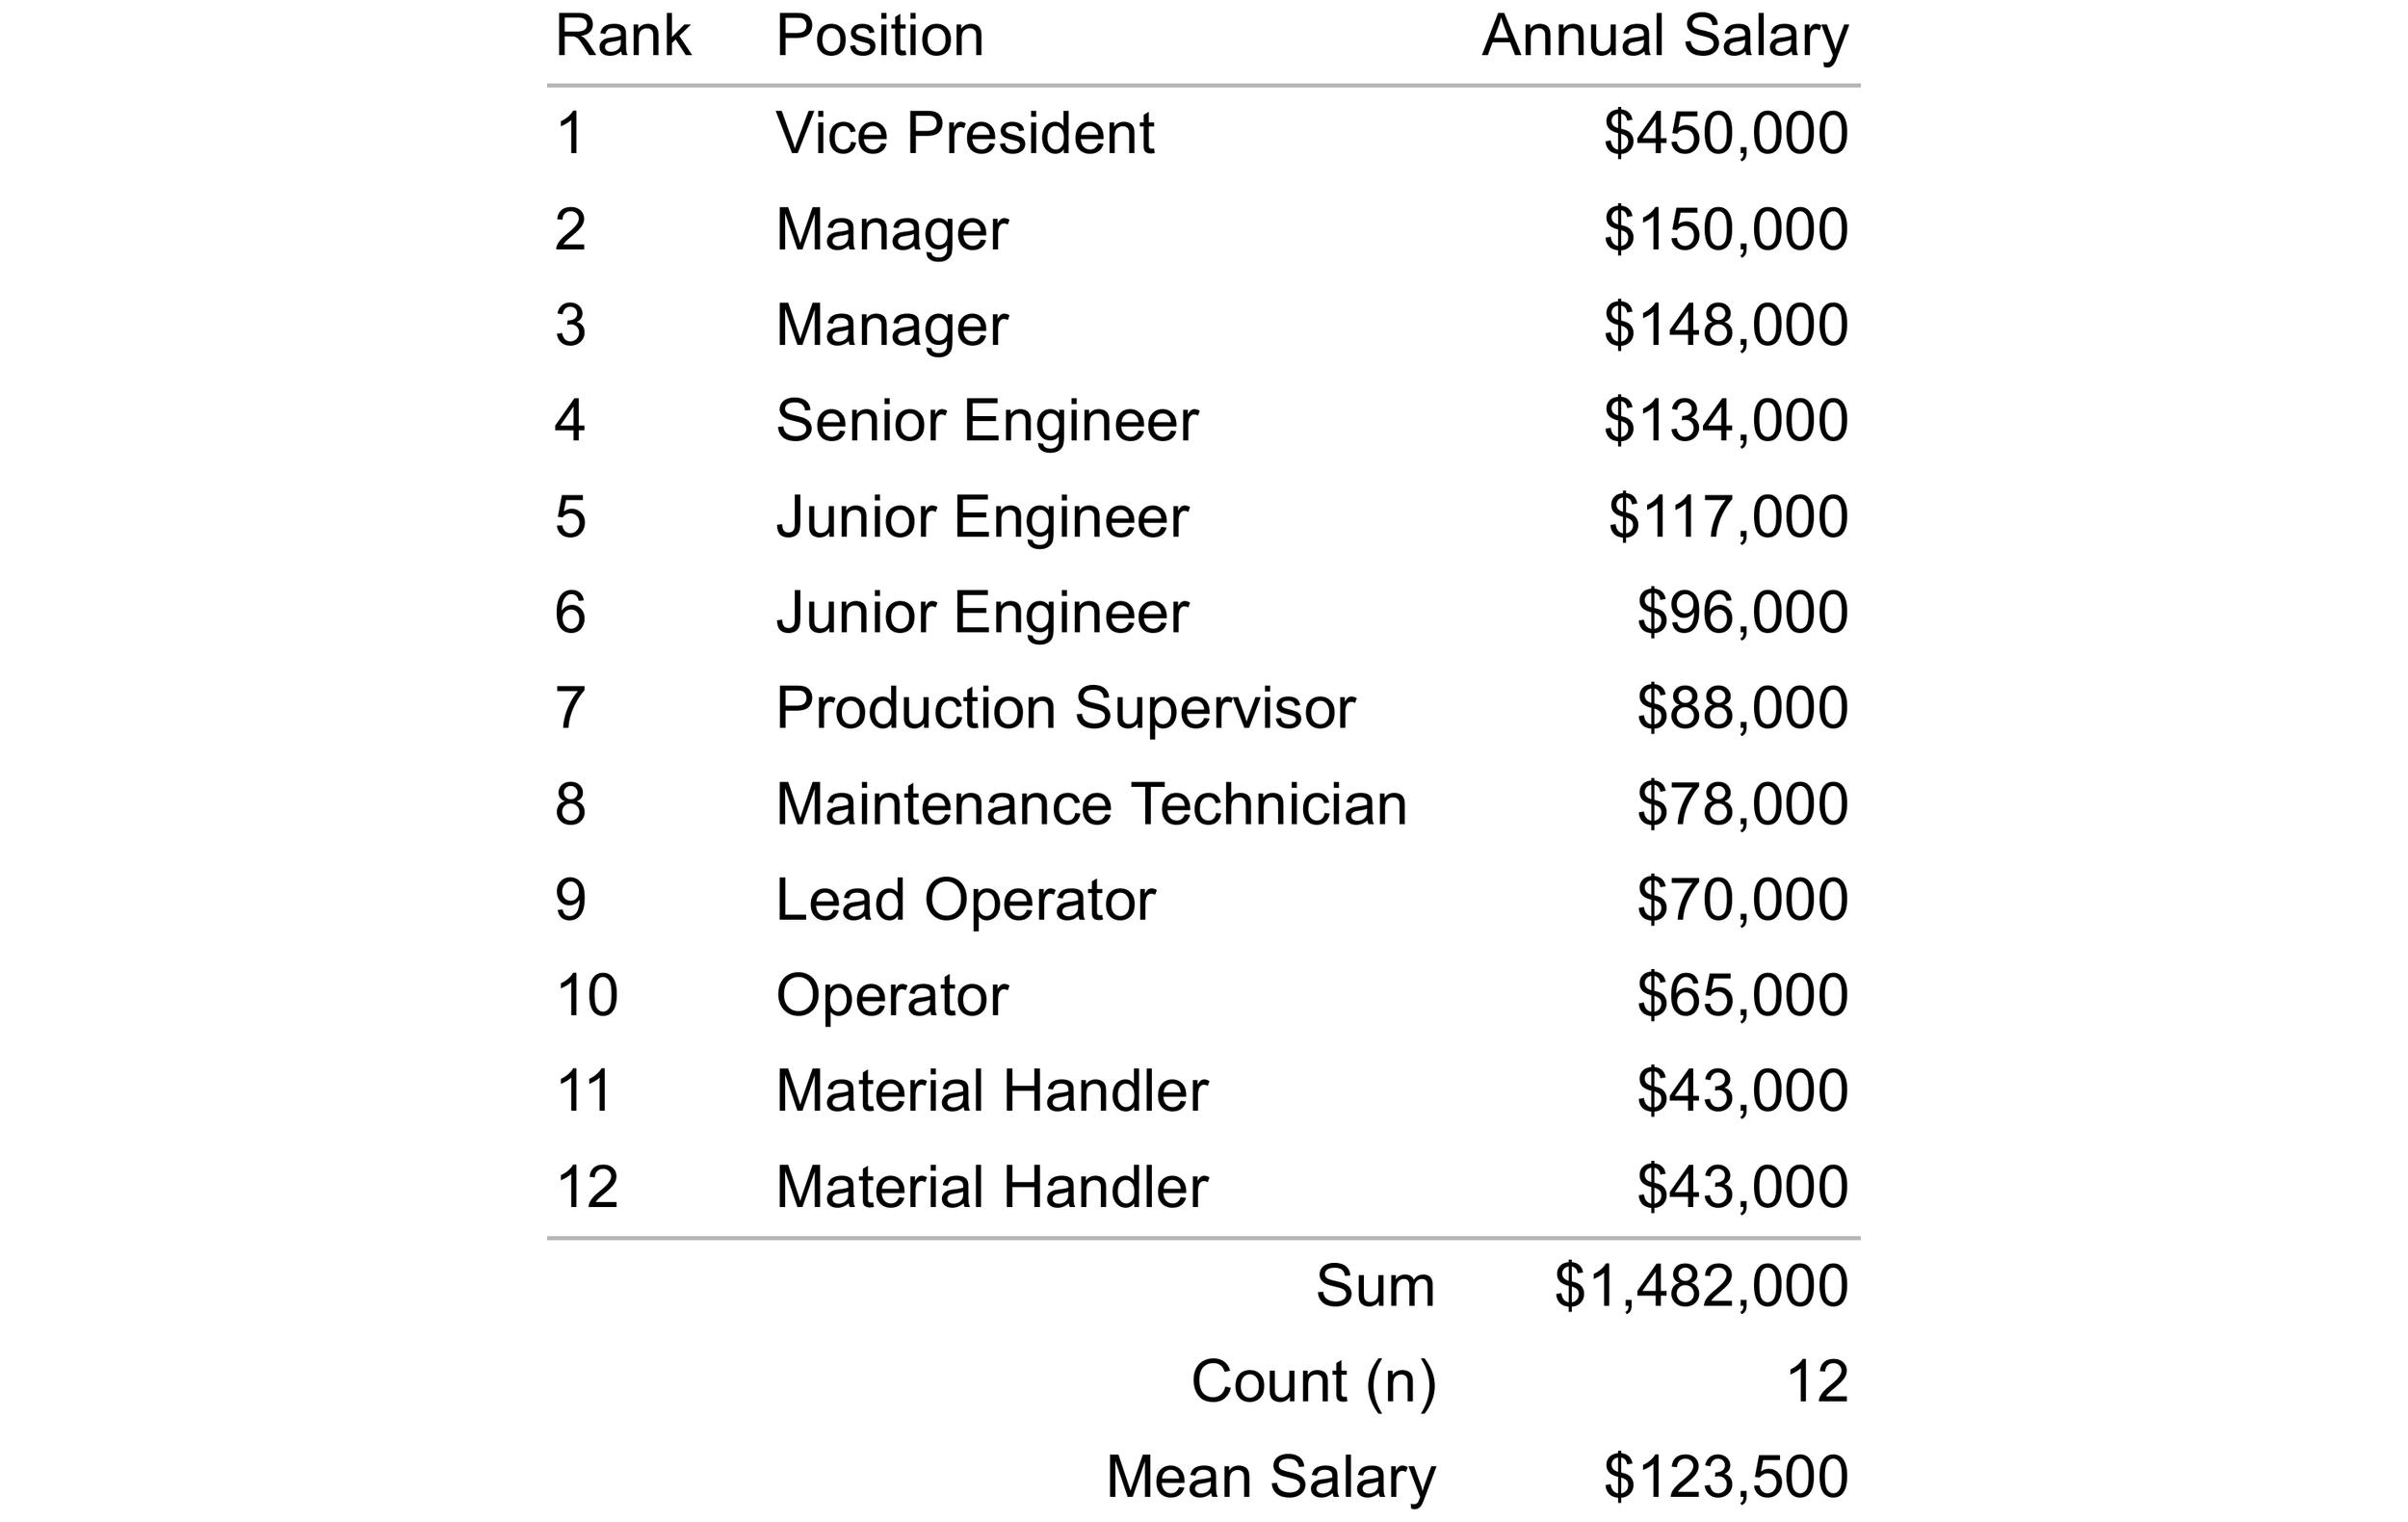
Table 1. Annual salaries for 12 employees with the associated sum, count, and mean.
To calculate the mean, first add all the annual salaries in the Annual Salary column. The result of this addition is $1,482,000. Next, divide this sum ($1,482,000) by the number of values in the dataset, n = 12. Dividing $1,482,000 by 12 yields a mean annual salary of $123,500.

Median
The median is a measure of location that describes a dataset’s center by splitting the data into two equal halves. Thus, the median defines a dataset’s 50th percentile.
If we let X denote the individual values in a dataset, the median of a set of X values can be denoted by placing a tilde (~) over the X, creating the symbol X̃ (read X-tilde). Assuming a dataset has been sorted in ascending (or descending) order, the median is calculated using the formula:

In this piecewise function, X̃ is the median, X represents the individual values in the dataset, and n is the total number of values in the dataset. Note that substituting n into this piecewise function yields the location (index) of the value that represents the median.
The median is calculated in two steps. First, all the values in a dataset must be sorted in ascending or descending order. Second, the middle value of the resulting ordered list must be identified. If the number of values in the dataset is odd, the median will be the middle value of the ordered dataset, located at the index (n+1)/2. If the number of values in the dataset is even, the median will be the average of the two middle values in the ordered dataset, located at the indices n/2 and (n/2)+1.
As an example, let’s calculate the median for the annual salaries in Table 2. We previously calculated the mean for these salaries in Table 1.
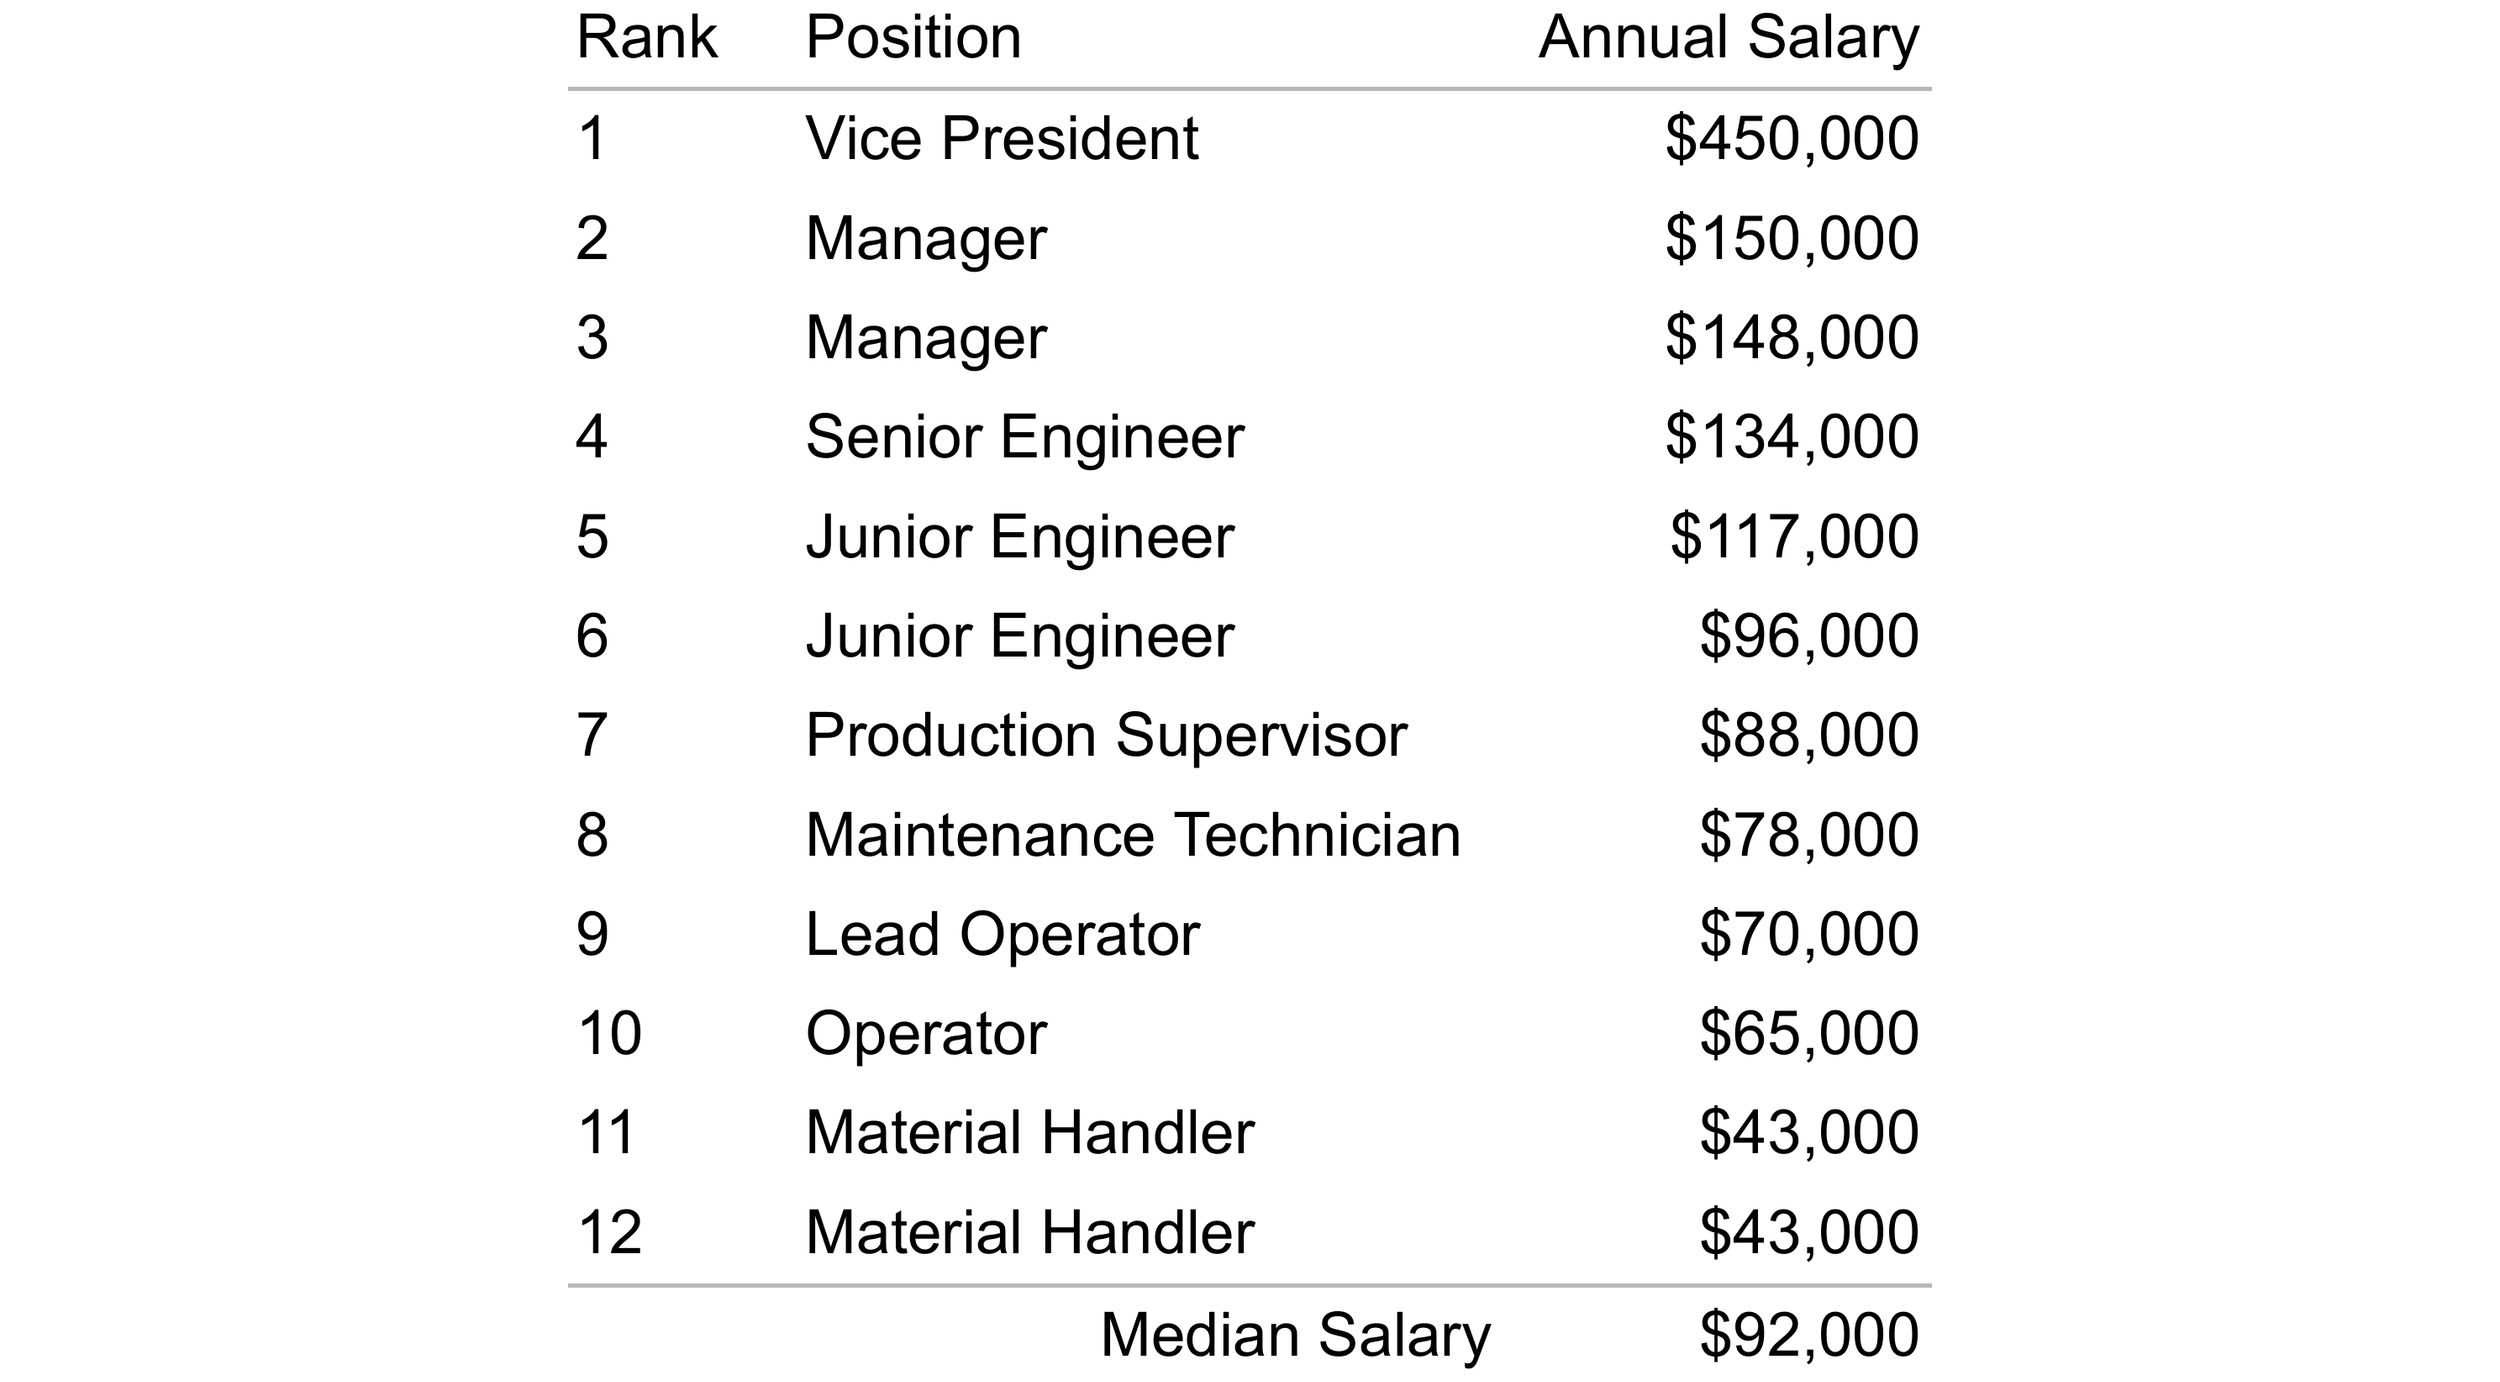
Table 2. Annual salaries for 12 employees with the associated median.
With the dataset already in descending order, the first step in calculating the median is complete. The second step is to determine the middle value of the ordered list. The dataset contains 12 salaries. Therefore, n = 12 and the even case of the piecewise function for calculating the median applies as follows:
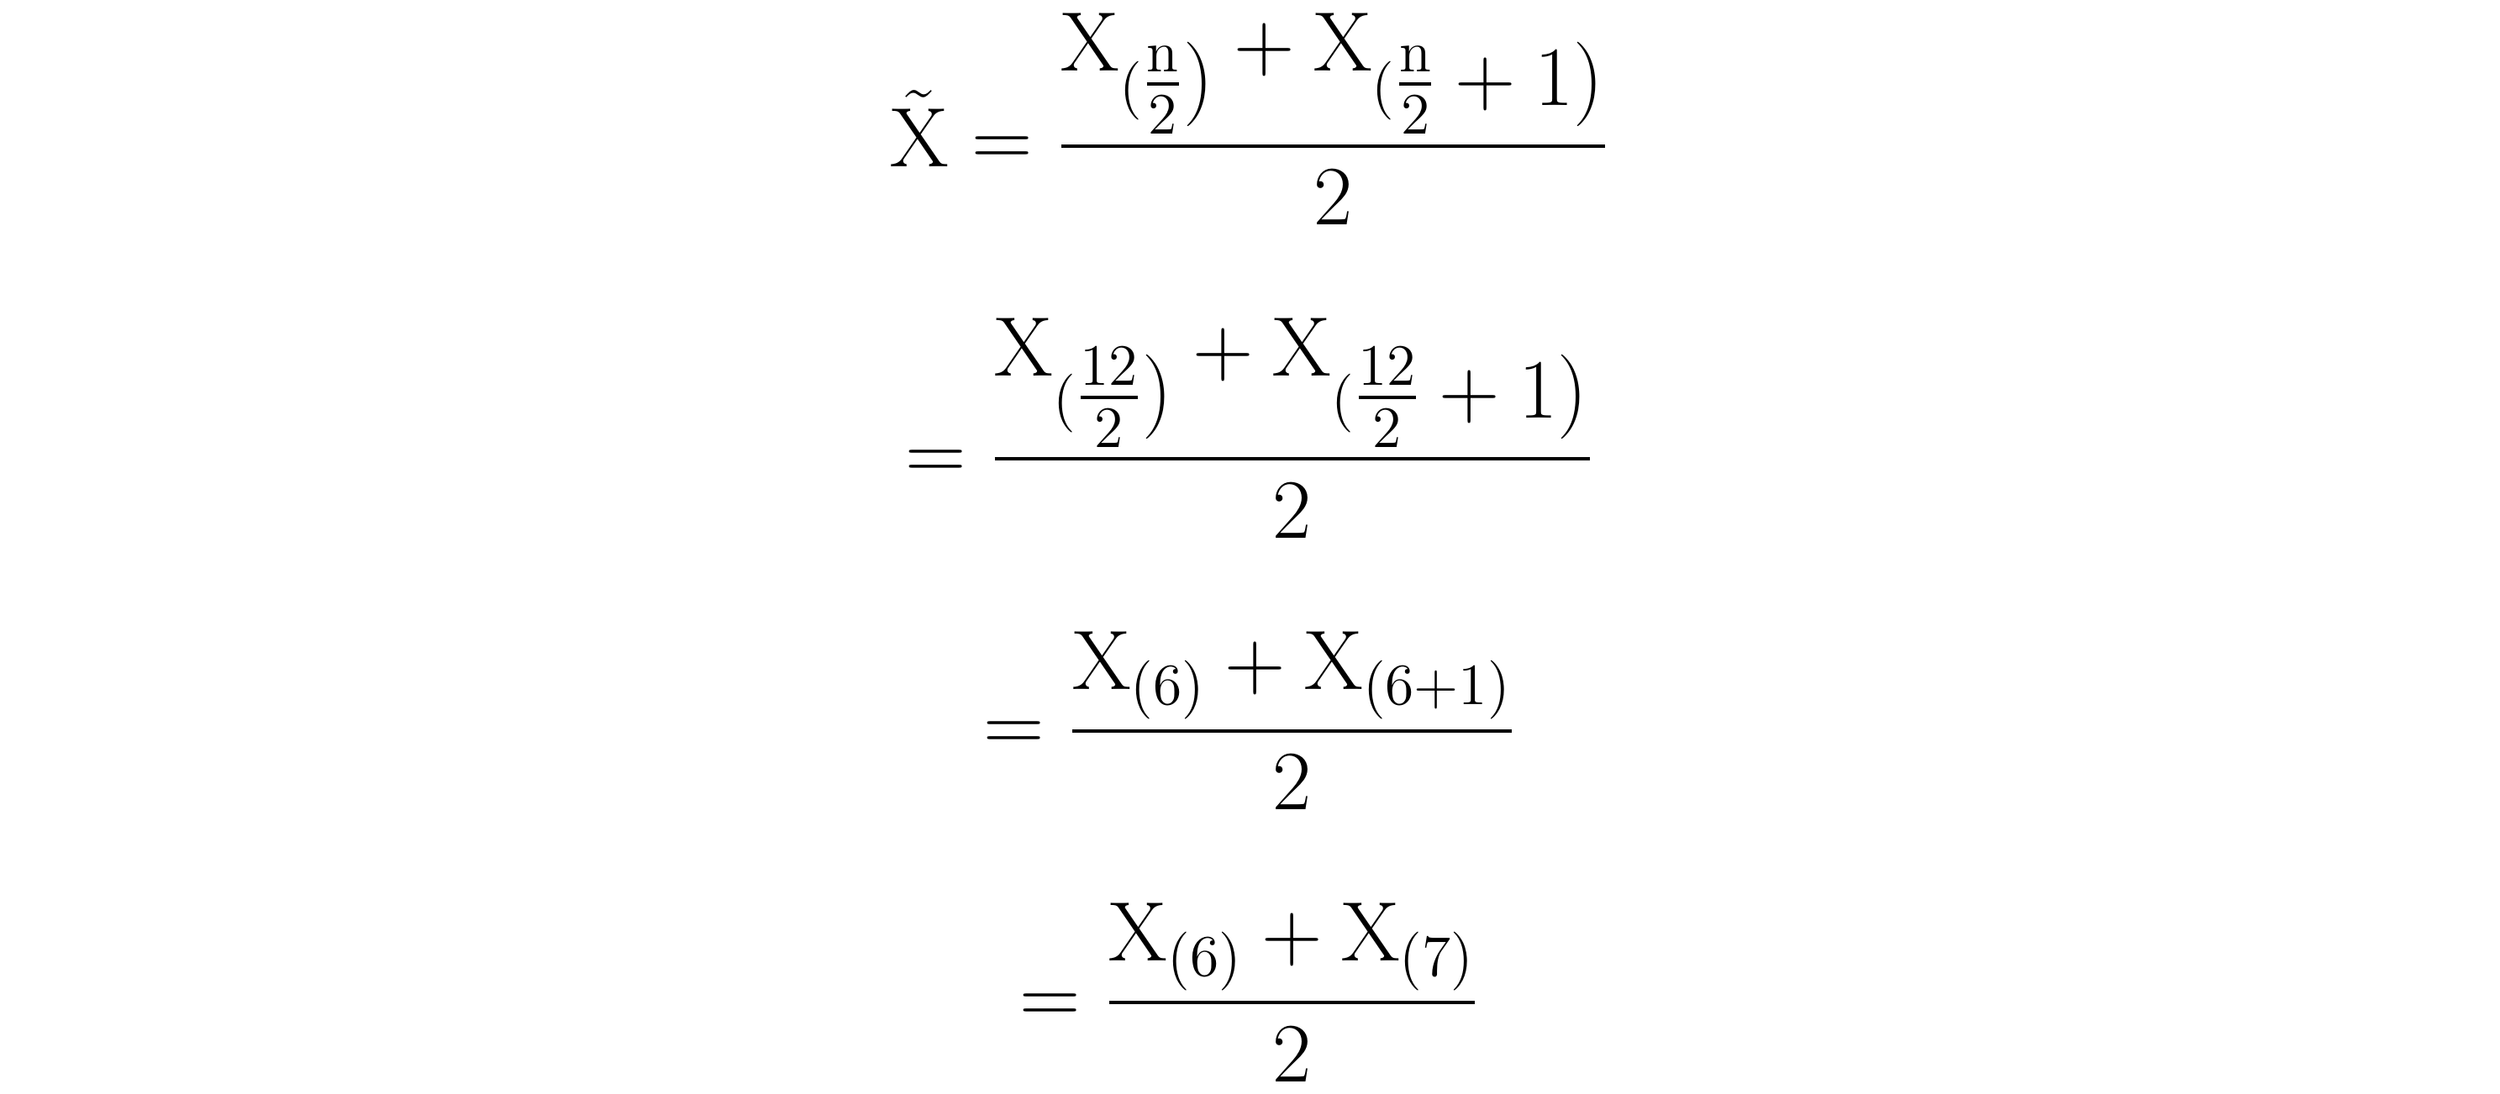
The median salary is the average of the values at the indices X6 and X7. The salary for the junior engineer at X6 = $96,000 while the salary for the production supervisor is X7 = $88,000. The sum of these salaries is $184,000. Dividing $184,000 by 2 yields a median salary of $92,000.

How does a median salary of $92,000 compare with a mean annual salary of $123,500? Given that there are 6 employees with annual salaries that make more than the median and 6 that make less, the median paints a more accurate picture of what is typical. Its calculation ensures that the description of the dataset’s center is not inflated like it was with the mean.
Figure 3. Bar chart of annual salaries and the associated median.