

Centered Performance Ratio, Pp
The centered performance ratio, Ppk, divides the distance to the nearer specification, DNS, by the quantity 3s. Thus, it expresses the effective space available to a process as a multiple of the space used by the process in the past. By comparing the centered performance ratio with the performance ratio, a characterization of how far off-target a process is operating is revealed. As the two ratios converge, the closer a process is operating to on-target. As the two ratios diverge, the further a process is operating from on-target. Note that the characterization of how close to target a process is operating by comparing the performance ratios is the same characterization that is revealed by comparing the capability ratios.

The relationship between the effective space available and the space used in the past is clarified in Figure 1. Here, a generic distribution of individual values is shown in the context of the effective space available (2 DNS), the space available (tolerance),and the space used in the past, as defined by the term Average ± 3 s. The s in the term 6 s is the global standard deviation statistic. It should not be confused with the within-subgroup measure of dispersion Sigma(X), the defining term in the denominator of the Capability Ratio and the Centered Capability Ratio.
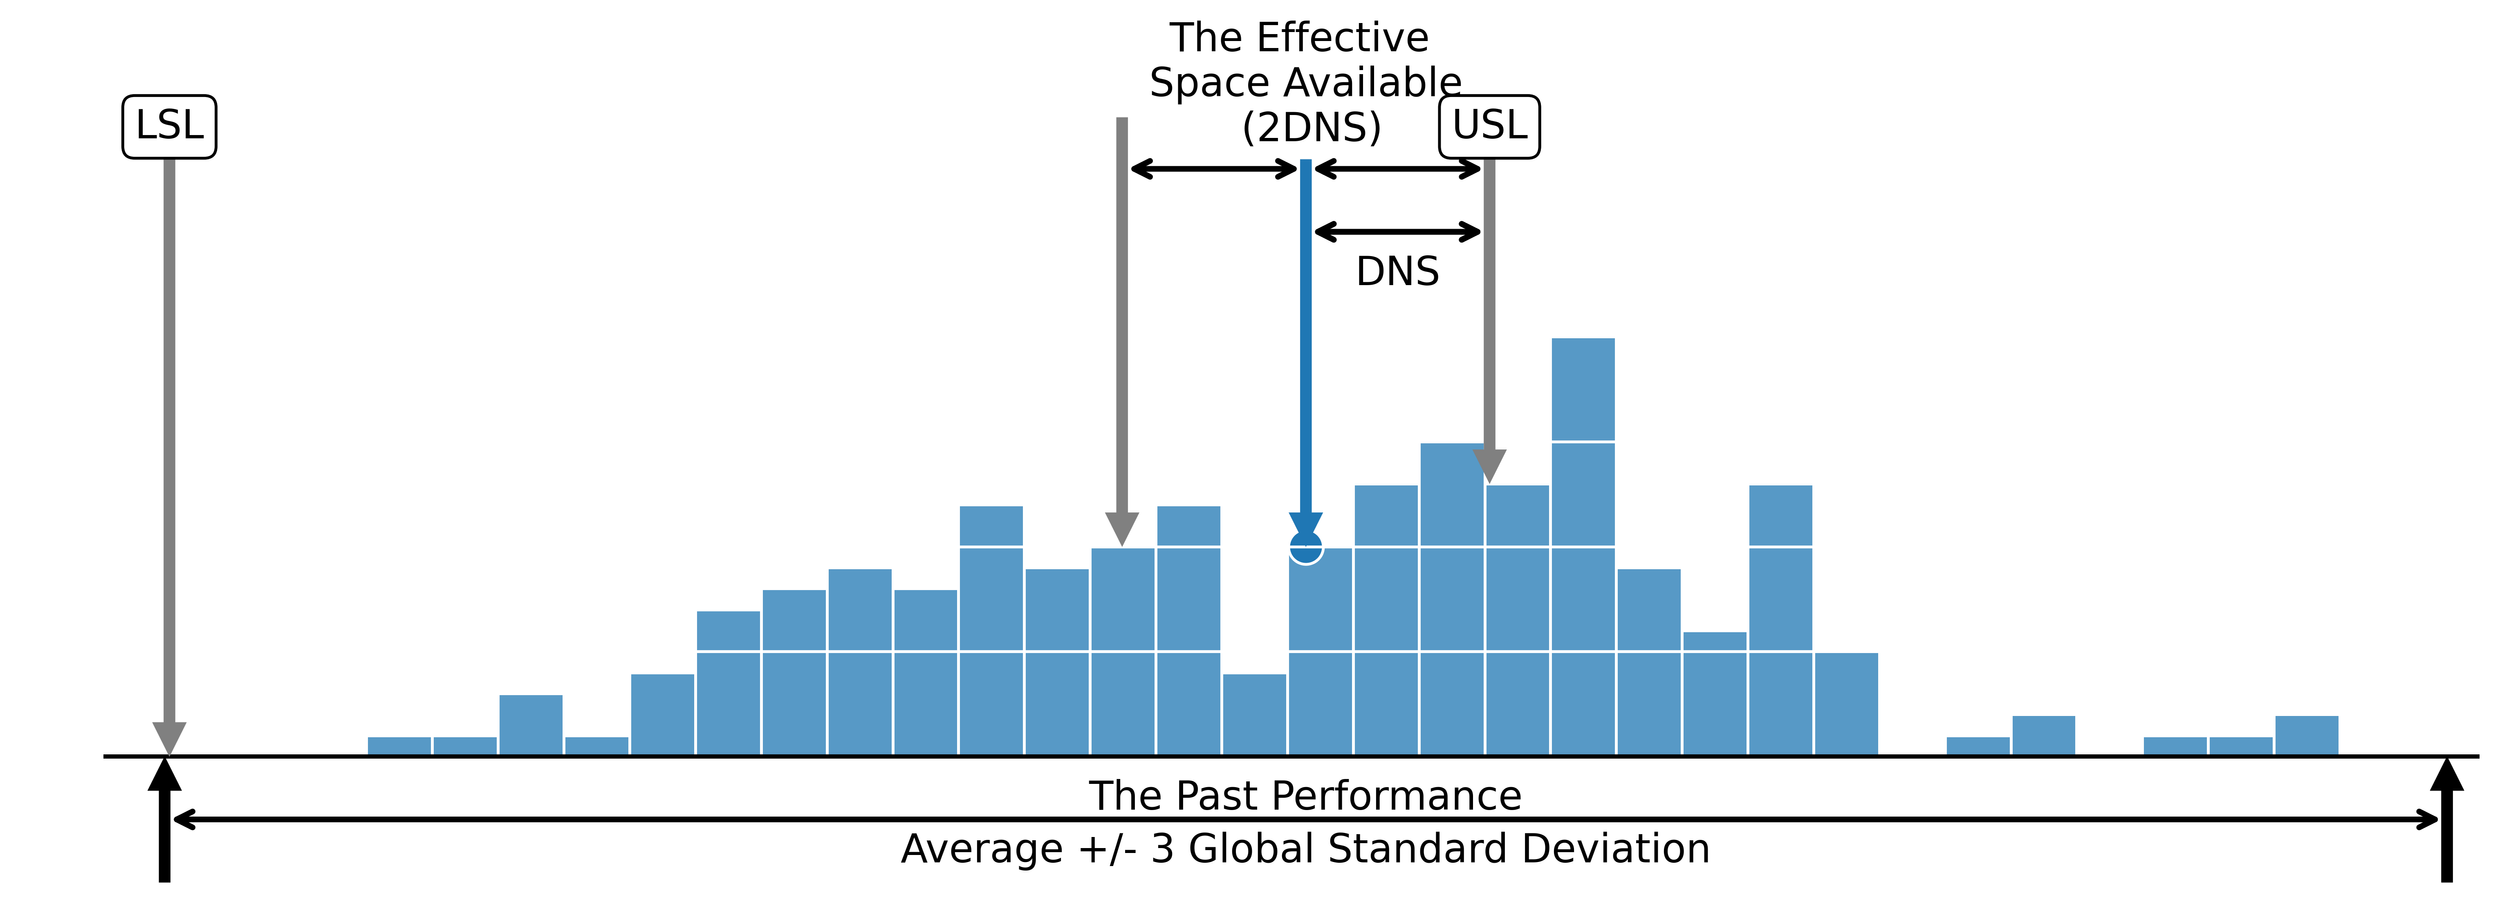
Figure 1. The relationship between the effective space available and the space used in the past by the process.
A word of warning
The centered performance ratio, like all process parameters, is not well-defined until the underlying causal system is operated predictably. Whenever a process is operated unpredictably, that is it is influenced by both common causes of routine variation and assignable causes of exceptional variation, the process parameters, including the process mean, the process standard deviation, and the process capability indices, will change over time. While we can always compute statistics regardless of the characterization (predictable or unpredictable), the only time this arithmetic can be used to estimate process parameters is when the process is operated predictably. When a process is operated unpredictably “the process parameters are changing and are therefore divorced from the statistics” used to calculate them (Wheeler, More Capability Confusion, 2).
It is for the above reason that the process capability indices should always be reported with the additional context of a process behavior chart and a capability histogram. The process behavior chart will characterize process behavior as predictable or unpredictable. In doing so, it will reveal the voice of the process. The capability histogram will visualize the relationship between the specification limits (tolerance) and the process data. In doing so, the capability histogram reveals the relationship between the process data and the voice of the customer.
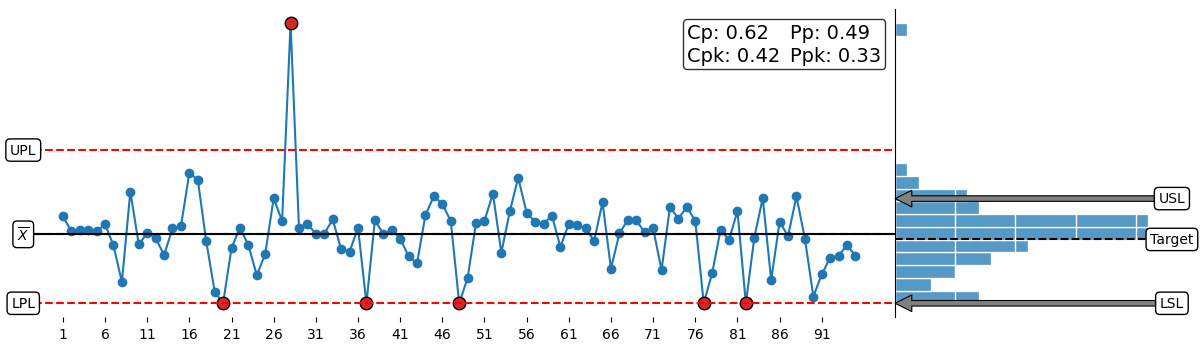
Figure 2. The X chart portion of an XmR chart (left) and the associated capability histogram (right).