

process_improvement.py
The process_improvement.py Python library performs calculations and generate figures that help users understand variation in business and manufacturing processes.
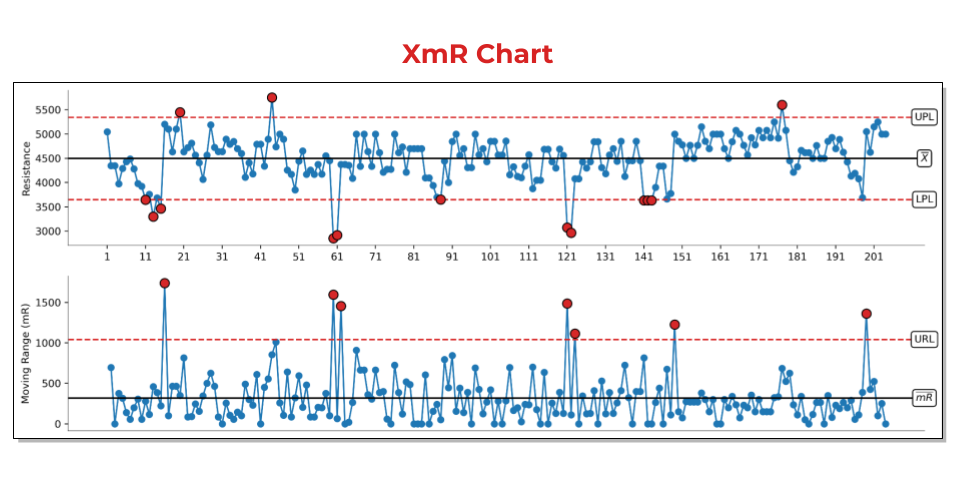
Figure 1. The XmR chart is the Swiss Army Knife of process behavior charts.
The primary tool of this library is the chart of individual values and a moving range called the XmR chart. However, the library is capable of generating other figures including:
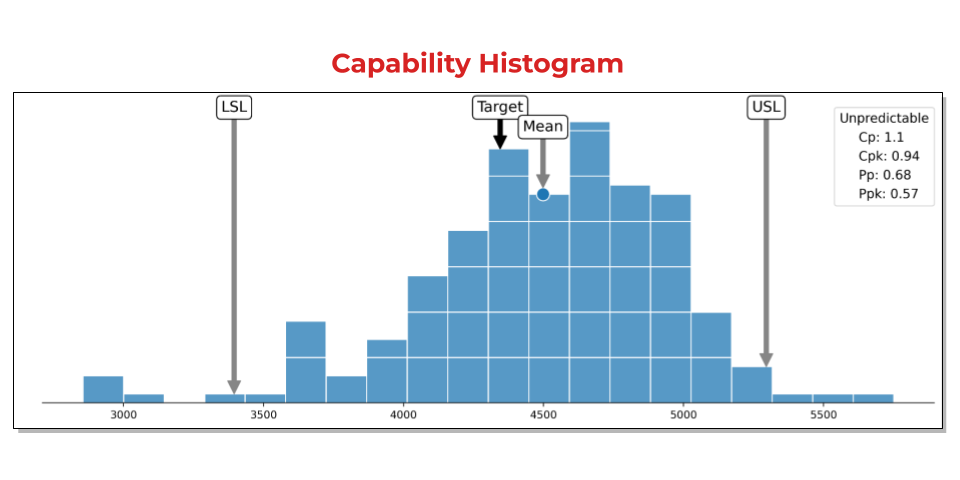
Capability histogram
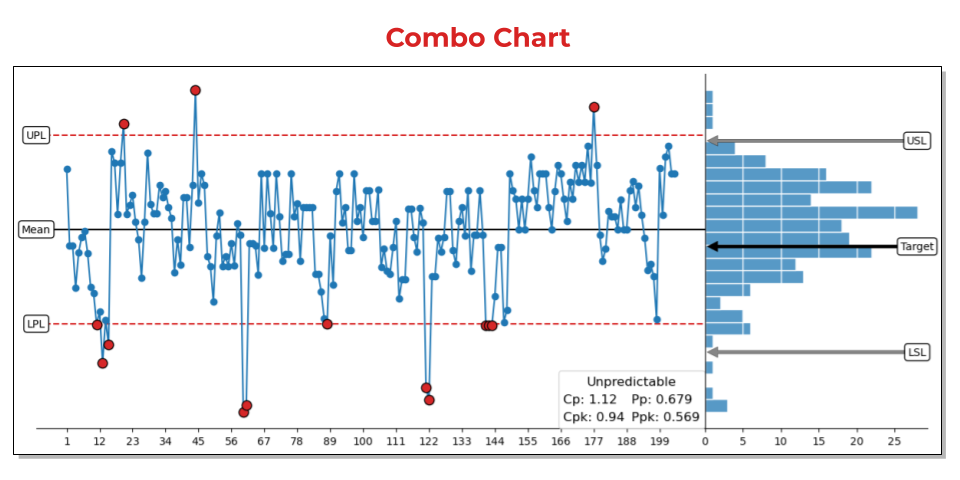
Combo chart
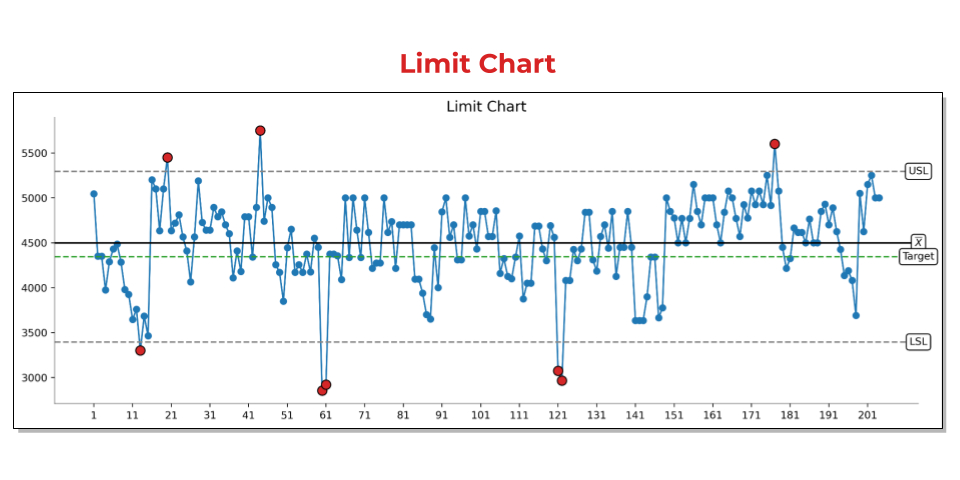
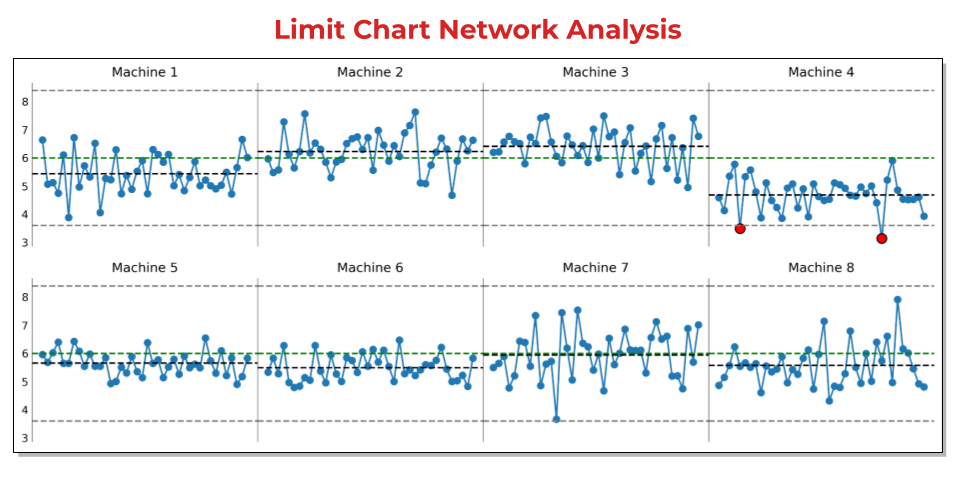
Limit chart
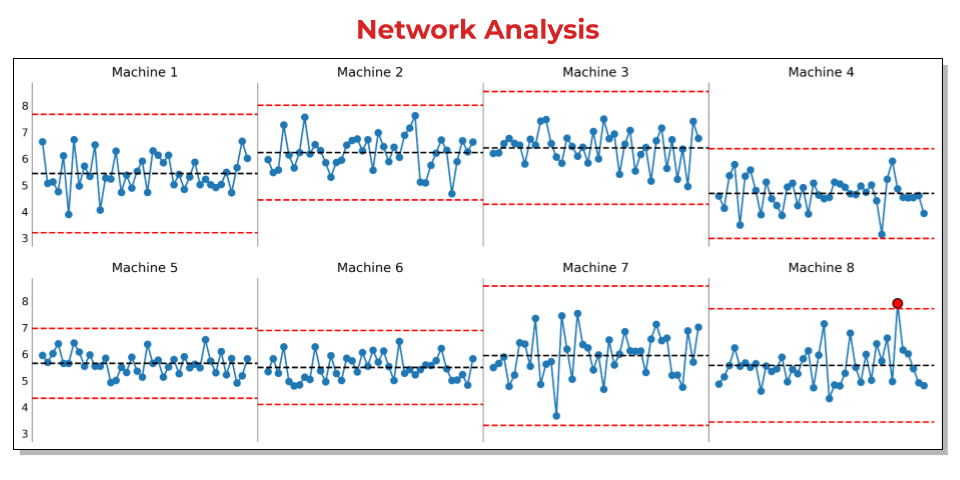
Limit chart network analysis
Network analysis
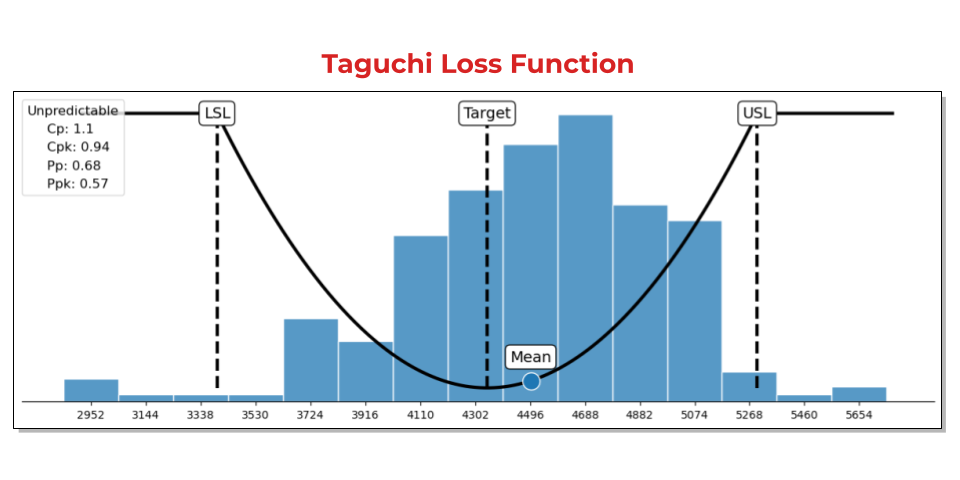
Taguchi loss function
XmR chart comparison
To learn more about each of these functions visit GitHub.com/jimlehner/process-improvement.
The process_improvement library can be pip installed using the