

The Process Principle
The challenge of manufacturing is the challenge of making parts, assemblies, and products that are, for all intents and purposes, the same. And yet, as hard as we try, differences in manufacturing outputs persist. Sometimes these differences are small, while other times they are large. Sometimes they are negligible, while other times they are consequential. Regardless of the scale, differences in outputs are an unavoidable feature of manufacturing that is both described and governed by the process principle.
The process principle states that
Whether we can measure it or not, the sequential outputs of a process are subject to some degree of difference.
That is, no two items produced by the same process—with the intention of making them identical—will ever be exactly the same. Differences will always exist, although they may not be measurable.
The process principle asserts itself in even the simplest of manufacturing processes. Take the task of drawing a sequence of six capital letter As (see Figure 1). While it’s obvious that all 6 efforts in Figure 1 have produced a recognizable letter, no two of the As are the same. The base of some As is wide, while others are narrow. The tip of some are rounded, while others are pointed. All 6 efforts have produced an A, but no two are identical, just as the process principle has us expect.
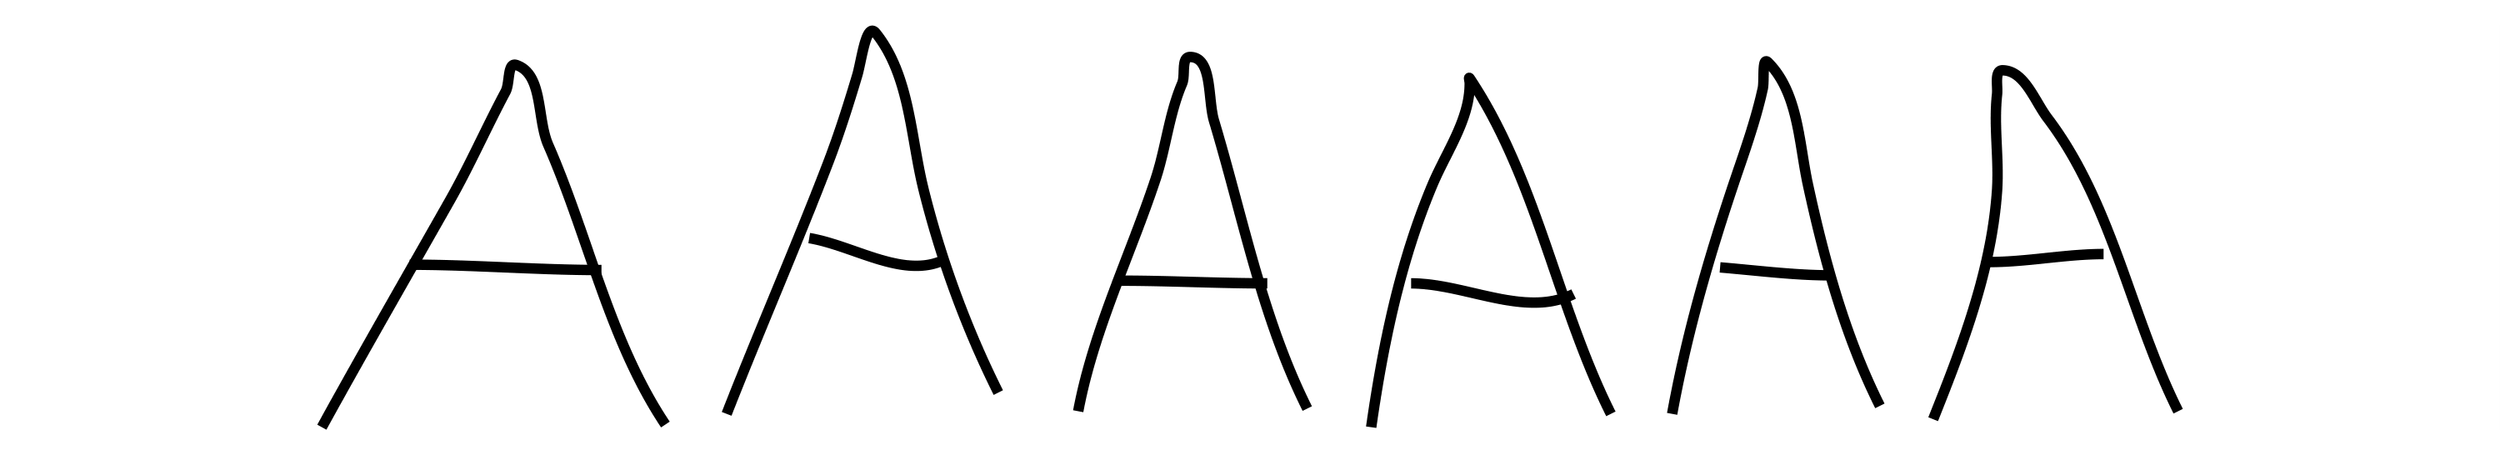
Figure 1. The process principle asserts itself in even the most simple of tasks like drawing a sequence of As.
Why is the process principle important?
The process principle is a broad framework for how to think about, understand, and approach the challenge of manufacturing. It forces the consideration of differences in parts, assemblies, and products as a feature of manufacturing, not a bug. This ensures that the questions asked and the answers sought when improving manufacturing processes always serve to understand and mitigate differences, rather than accept them as an immutable and inconvenient part of doing business.
Chief among the questions that the process principle prompts is:
What is the cause of the differences in process outputs?
The answer is one that is so obvious that it has become obscured—variation.
Variation is the degree to which the sequential outputs of a process or system differ. These differences are the product of the two types of variation: common causes of routine variation and assignable causes of exceptional variation. Thus, the process principle highlights the central role that understanding variation plays in manufacturing. Without an understanding of variation, process improvement is a function of good luck instead of analysis. While good luck is always welcome, it does not constitute a method that can reliably and repeatedly produce results. To do that numbers must be imbued with meaning and data must be put in context. When data is the by-product of processes and systems, the most effective way to put it in context is by using process behavior charts.
The process behavior chart
The process behavior chart is the only tool capable of discriminating between the two types of variation, and therefore the only tool that can make sense of the differences that the process principle tells us we should expect (see Figure 2). Discriminating between the two types of variation with the process behavior chart is achieved through calculated boundaries called process limits. These limits define how large or small a value must be before it represents a departure from the historic mean. When one or more values fall outside the process limits, both common causes of routine variation and assignable causes of exceptional variation influence process behavior. When all of the values fall inside the process limits, only common causes of routine variation influence process behavior.
Figure 2. The process limits of a process behavior chart discriminate between common causes of routine variation and assignable causes of exceptional variation.
When influenced by only common causes of routine variation, process behavior is characterized as predictable. Although many in number, common causes are minimal in their effect. Thus, when only common causes are present, the future behavior of a predictable process can be predicted within limits. However, just because process behavior can be predicted within limits does not mean the behavior is desirable. A predictable process can still produce nonconforming material by operating off-target, with variance, or off-target with variance. In these instances, improvement requires the introduction of new technology, new equipment, new materials, or new procedures. Without these improvements, mitigating the influence of common causes is impossible.
Figure 3. The two types of variation.
When influenced by both common causes of routine variation and assignable causes of exceptional variation, process behavior is characterized as unpredictable. Although few in number, assignable causes are dominant in their effect. Thus, until assignable causes are eliminated, future process behavior cannot be predicted within limits. In these instances, improvement requires the elimination of assignable causes. Until this is achieved, process behavior will bounce and shift in unpredictable ways.
Summary
The process principle states that no two parts, assemblies, or products produced by the same process will ever be the same. Differences, whether we can measure them or not, will always exist. This reframes the challenge of manufacturing as the challenge of mitigating differences instead of accepting them as immutable. It prompts questions about the cause of differences and promotes methods that facilitate the search for answers.
Among the questions that the process principle prompts is: What is the cause of the differences? The answer—variation.
Variation is the degree to which the sequential outputs of a process or system differ. Thus, by understanding variation an understanding of the causes of the differences in process outputs is revealed. However, this is only possible with the help of the process behavior chart.
Through the calculation of process limits, process behavior charts define how large or small a value must be before it represents a departure from the historic mean. It ensures that when only common causes of routine variation are present, improvement efforts introduce new technology, new equipment, new materials, and new procedures. When both common causes of routine variation and assignable causes of exceptional variation are present, it ensures that the assignable causes are identified and eliminated.